Figure 4.
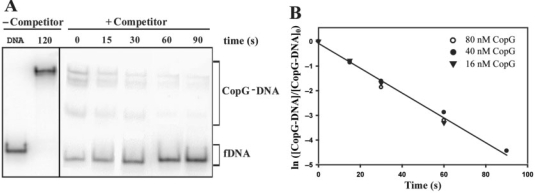
Kinetic of dissociation of CopG from its operator at 37°C. (A) EMSA analysis of the stability of the CopG–DNA complexes. Dissociation of complexes between CopG (40 nM) and the labelled DNA was initiated by addition of a 50-fold excess of unlabelled DNA (t = 0), and samples were analyzed at the indicated times. The sum of the various CopG–DNA complexes (in brackets) was used to analyze the time course of the fraction of labelled DNA complexed to CopG. Samples of free DNA (fDNA) and of the equilibrium mixture without competitor were also loaded at t = 120. All the lanes displayed came from the same gel. (B) Time course of CopG–DNA complex dissociation. Data from three independent experiments, each performed at the indicated CopG concentration, are included. The kd values estimated were (5.5 ± 0.1) × 10−2 s−1 (16 nM CopG), (4.8 ± 0.2) × 10−2 s−1 (40 nM CopG), and (5.3 ± 0.7) × 10−2 s−1 (80 nM CopG). The solid line is the linear fit of all data.

