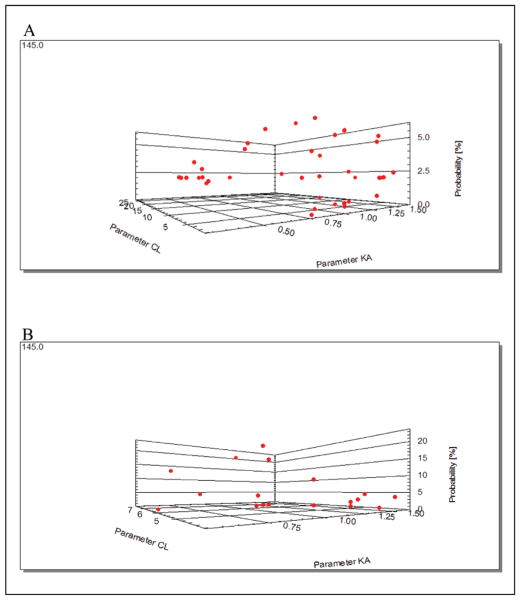
Figure 2.
Nonparametric population model for atazanavir with clearance and absorption on the horizontal plane and the associated probability of each set of estimates on the vertical axis. There is at most 1 point per simulated individual in the population, although individuals with similar parameter estimates within the context of model error will not be resolvable as separate points. The population model (the Bayesian prior) is shown in (A), and the individualized Bayesian-posterior model for patient 4 is shown in (B) fitted to that patient’s measured atazanavir concentrations. Some points in the model have risen to higher probabilities (note the changed vertical axis scale), other points are lower, and half are so unlikely as to not be plotted. The more probable sets of parameter estimates are now accorded more weight in selecting the dose that minimizes the least-squared error between the predicted and observed concentrations for the patient.

