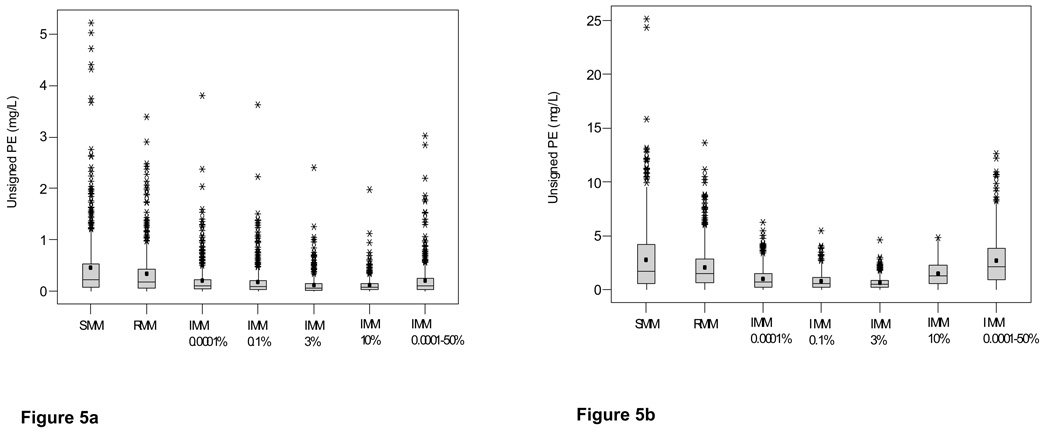
Figure 5.
Box and whisker plots of unsigned prediction errors arising from SMM, RMM and IMM Bayesian analysis of (a) gentamicin and (b) vancomycin data collected from cardiothoracic surgery patients
Key: SMM simple multiple model Bayesian analysis, RMM richer data multiple model, IMM interacting multiple model with fixed probabilities of 0.0001%, 3% and 10% and a range of 0.0001–50%; means are indicated by solid circles
Footnote: The IMM 3% probability setting gave the most precise and the SMM setting the least precise estimates of both gentamicin and vancomycin concentrations. The 0.0001–50% probability range was the least precise IMM setting for both antibiotics.

