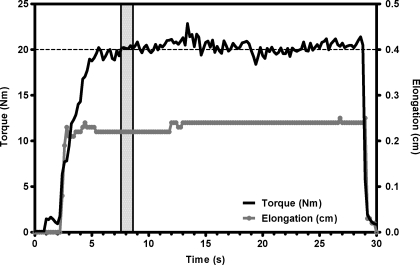
Fig. 3.
Sample torque and elongation curves over a single 30-s trial. Torque is plotted in black on the left axis and elongation is plotted in gray on the right axis. The horizontal dashed line represents the target torque for this trial (20 N·m), and the vertical shaded area represents the 1-s period from which the tendon strain values were calculated.

