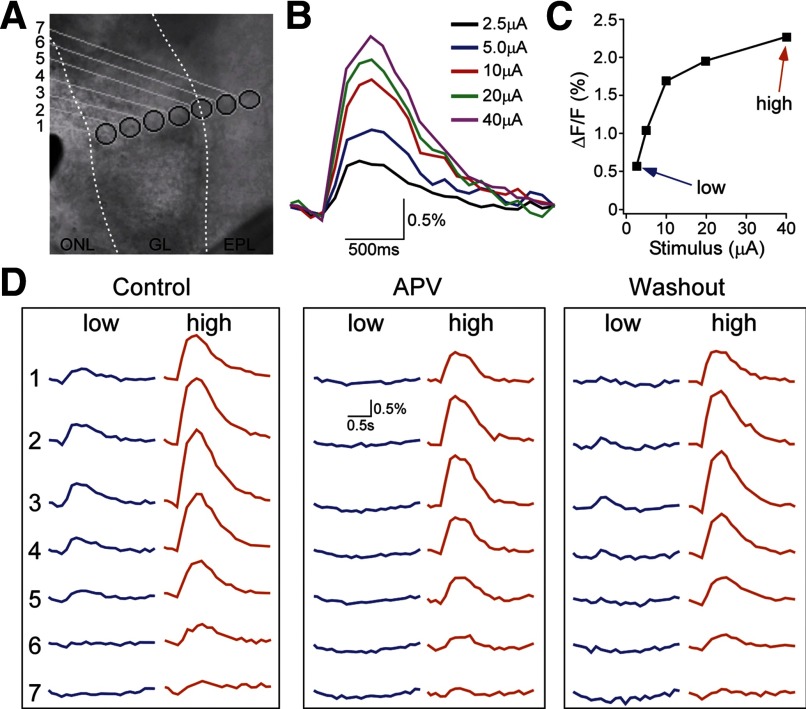
FIG. 4.
Pharmacological analysis of the ON-evoked GCaMP2 response. A: an infrared DIC imaging of an olfactory bulb slice prepared from a GCaMP2 mouse. The borders between the ONL, GL and EPL are delineated with 2 white dashed lines. The black shade located near the left margin of the image is the tip of a concentric bipolar stimulating electrode used to activate olfactory nerve input. The numbered circles mark the ROIs from which GCaMP2 signal traces in D were measured. B: electric stimulation-evoked GCaMP2 response increased with stimulus intensity. Data were sampled from ROI 3. C: plot of ΔF/F versus the stimulus current. The blue and red arrows denote the low and high stimulus intensities with which the data in D were imaged. D: spatial profile and pharmacology of GCaMP2 signals evoked by the 2 different stimulus intensities. Left: control responses. Middle: bath application of 50 μM APV selectively blocked the glomerular GCaMP2 responses to the weak stimulus, but only partially suppressed the strong stimulus-evoked responses. Right: wash-out.

