FIG. 8.
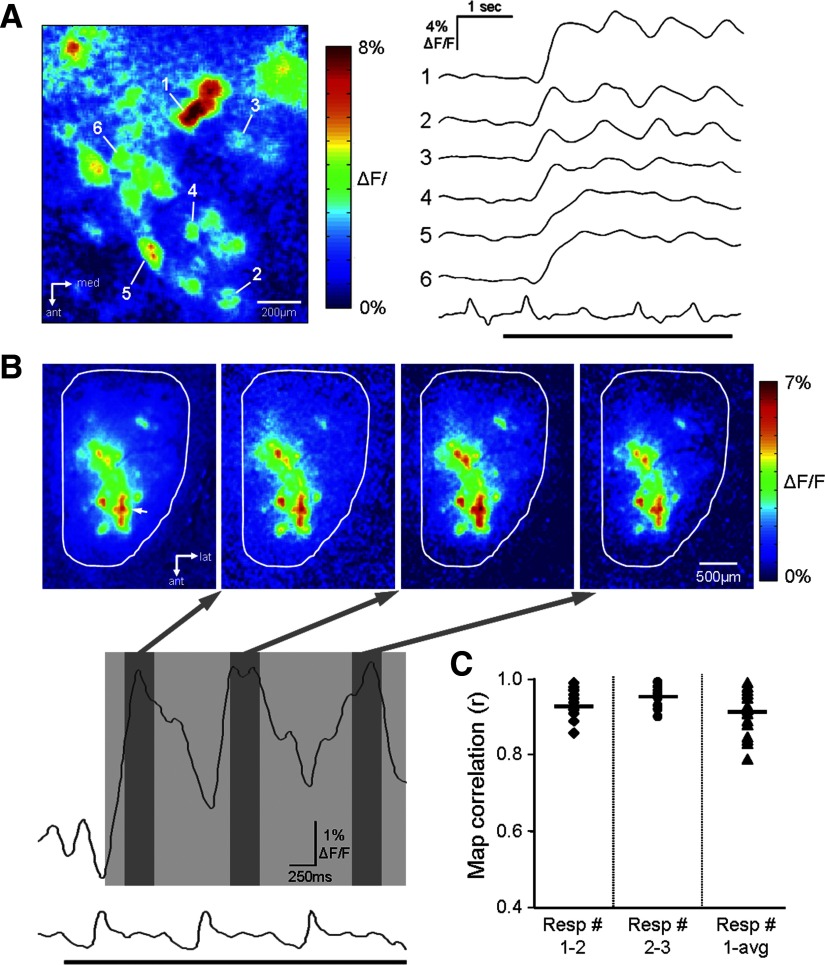
Correlation between odor-evoked GCaMP2 glomerular response signals with animal respiration cycles. A, left: a glomerular odor response map evoked by 0.25% propanal. Right: traces are the response time courses of six different glomeruli aligned with respiratory cycles. Note that glomeruli 1–3 displayed strong phasic responses that closely followed each inhalation. The upward deflections of the recorded respiratory trace represent inhalation, and a black horizontal bar indicates odorant delivery. B: odor response maps in 3 consecutive respiratory cycles (resp 1–3) following the onset of 0.25% methyl valerate delivery. The 2 traces below the maps reflect the odor-evoked GCaMP2 fluorescence signal in an activated glomerulus (white arrowhead) as well as its correlation with the animal's respiration activity. The overall pattern of activated glomeruli varied very little across different inhalation cycles. The response maps generated from each cycle (as indicated by 3 dark gray boxes) strongly resembled the left-most map, which was an average of GCaMP2 response signals across the entire first three respirations (light gray box). C: quantitative analysis via cross-correlation to test for the odor-map stability across the 1st 3 respiration cycles following odorant delivery. Data set was taken from 13 animals, from which 18 odor maps were imaged in response to 5 different odorants.

