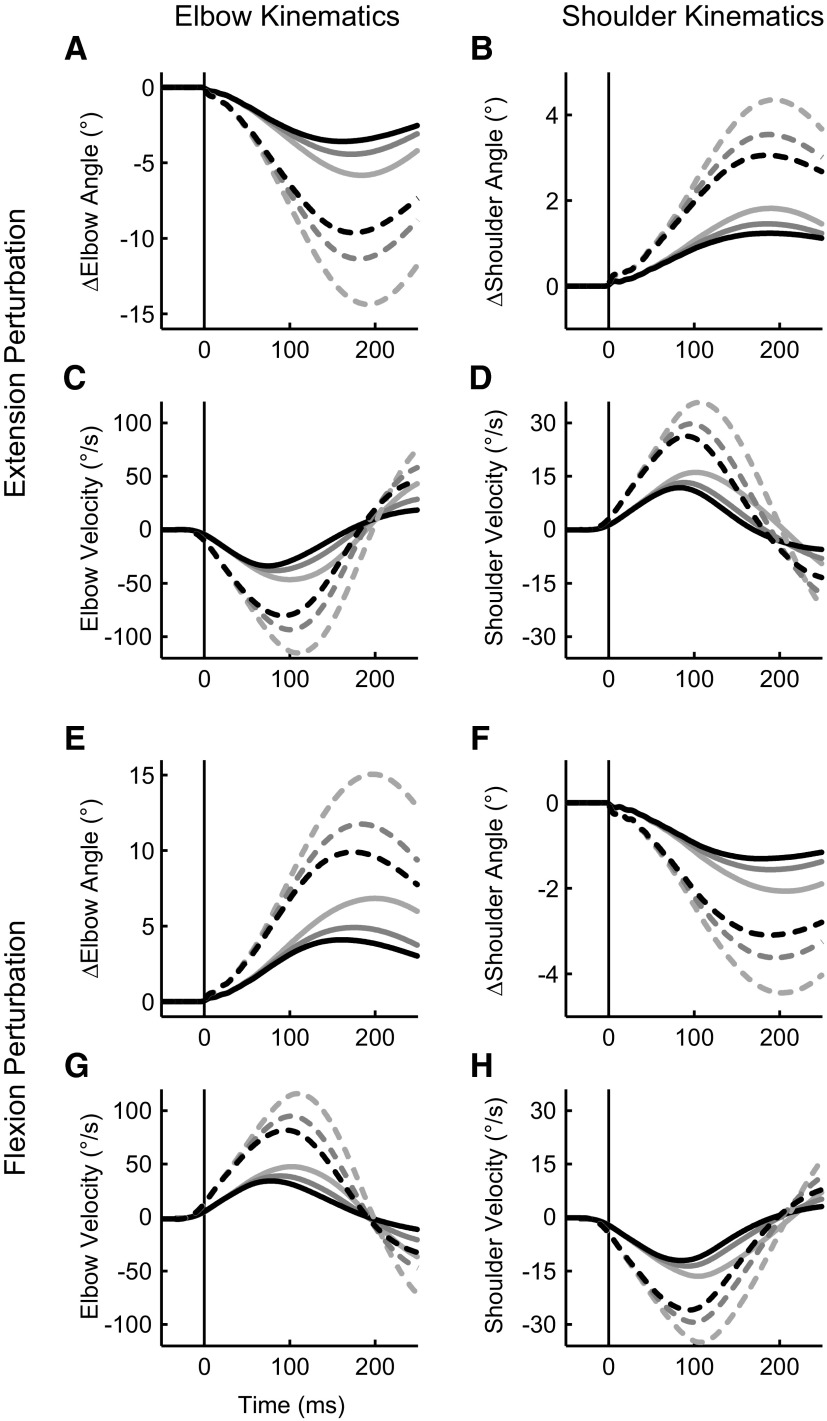
FIG. 3.
Temporal joint kinematics from an exemplar subject. A: elbow angle following an elbow extension perturbation (which stretches the elbow flexor muscles). The horizontal axis represents time relative to perturbation onset and the vertical axis shows the change in elbow angle relative to the initial configuration (shoulder = 45°, elbow = 90°). Solid (1.25 Nm) and dashed (2.5 Nm) lines denote perturbation magnitude and line shade denotes background load (light gray = 1 Nm, dark gray = 2 Nm, black = 3 Nm). B: resultant shoulder angle following an elbow extension perturbation. C: elbow velocity trajectory following an elbow extension perturbation. D: shoulder velocity trajectory following an elbow extension perturbation. E–H: same format as A–D except for an elbow flexion perturbation (which stretches the elbow extensor muscles).

