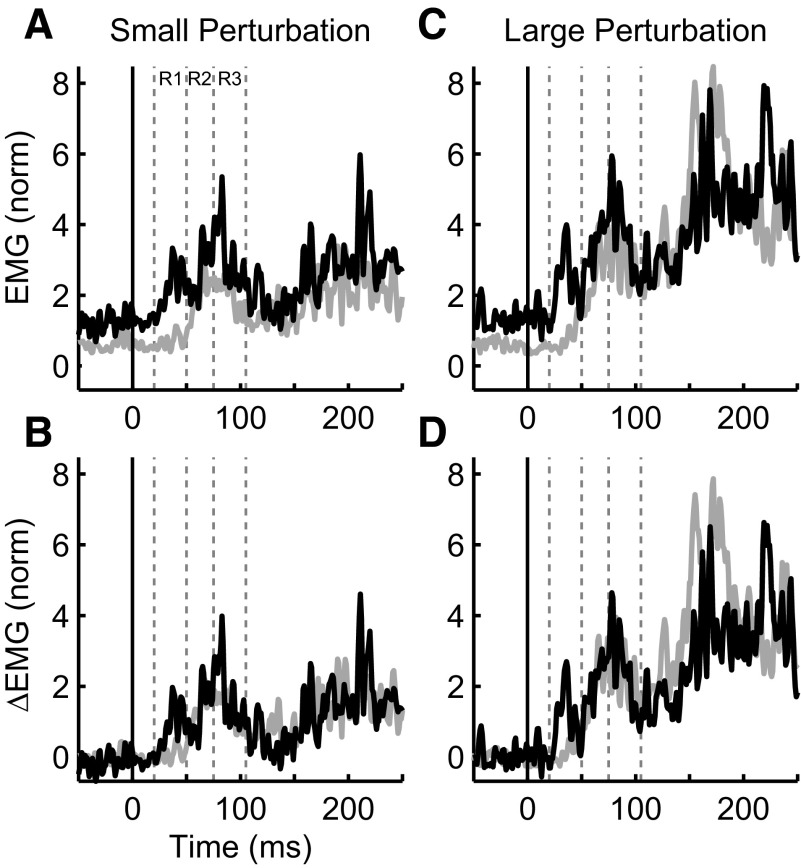
FIG. 5.
Exemplar patterns of muscle activity with different background and perturbation loads. A: electromyographic (EMG) activity from an exemplar muscle sample (triceps lateral, subject 2) for the small perturbation (1.25 Nm) but different background loads (light gray = 1 Nm, black = 3 Nm). Note that the middle (2 Nm) background load condition is omitted for clarity. The horizontal axis denotes time and is aligned to perturbation onset (black vertical line). The dashed vertical lines designate intervals for the R1–R3 epochs and are based on average responses across muscle samples (see methods). The vertical axis represents normalized EMG activity where a value of 1 represents EMG activity used to counter a 2 Nm background load. B: same data and format as in A except that the offset associated with background load activation has been removed. C: same format as A except for the large perturbation (2.5 Nm). D: same format and data as C with offset removed.

