
FIG. 7.
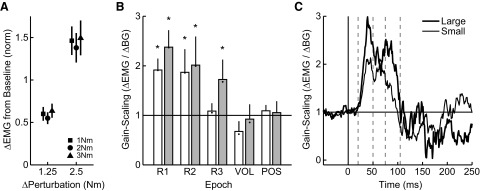
Analysis of gain-scaling across epochs and in time. A: linearity of steady-state muscle activity (750–1,250 ms postperturbation) associated with increased loads. The horizontal axis represents the change in load between background and perturbation and the vertical axis represents the resulting change in steady-state EMG. The 3 symbols denote the 3 initial background loads (square = 1 Nm; circle = 2 Nm; triangle = 3 Nm) and error bars represent SE across muscle samples. B: population data showing the sensitivity of muscle responses in each epoch to the background load. Results are shown for both the small (1.25 Nm, solid) and large (2.5 Nm, dashed) perturbations. The bars represent gain-scaling after correction for reduced joint motion (see methods). Dots within each bar show uncorrected gain-scaling. Symbols (asterisk) above each bar indicate significant gain-scaling (t-test, P < 0.05, gain-scaling >1). C: sensitivity of muscle responses to background load with respect to time. The horizontal axis represents time relative to perturbation onset and the vertical axis represents gain-scaling at each point in time. Thin and thick lines denote the small and large perturbations, respectively. Note that gain-scaling at each instant in time (1 ms) is smoothed with a 10-ms sliding window.