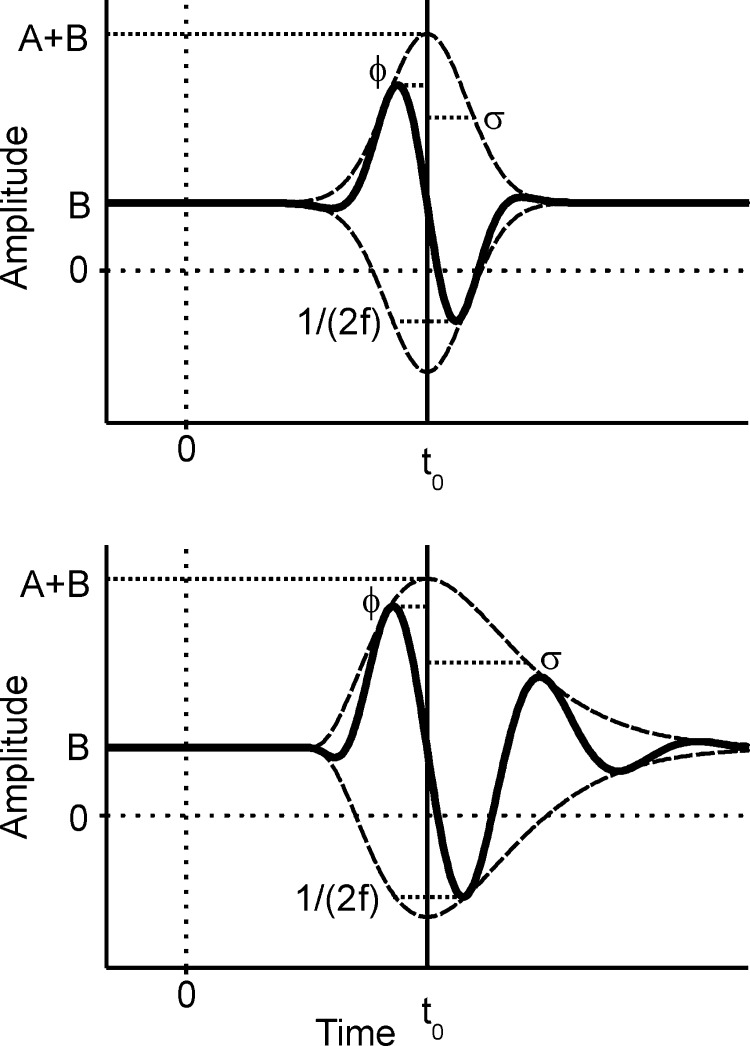
FIG. 1.
The Gabor (top) and the gamma-tone (bottom) functions. These functions were used to fit the oscillatory responses obtained with click stimulation. Note that the length of the dotted line near 1/(2f) corresponds to the half of the oscillation period. The other parameters are explained in the text.

