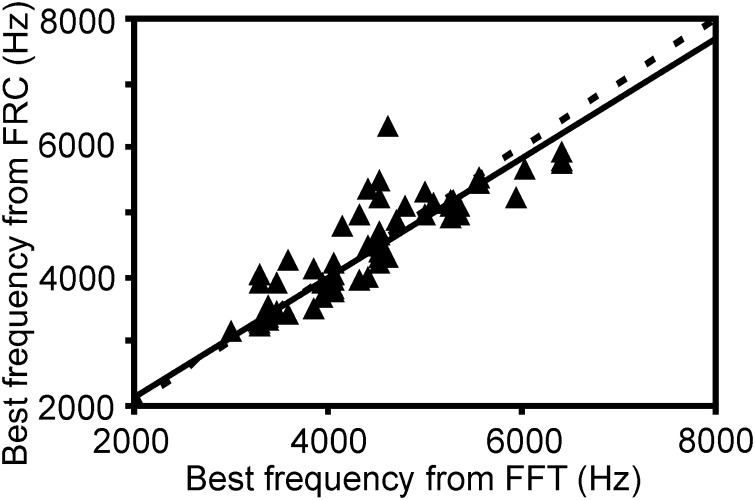
FIG. 4.
Comparisons of best frequencies (BFs) obtained with clicks and tonal stimuli. BFs obtained from iso-intensity frequency response curves (FRC) matched BFs obtained from the FFT at maximum power in high-frequency component of click response (65 cases at similar stimulus levels). Note the close correspondence between the 2 independent measurements with a correlation coefficient of 0.88, a y offset of 260 Hz and a slope of 0.93 [regression line (—)]. - - -, equivalence on the 2 axes.

