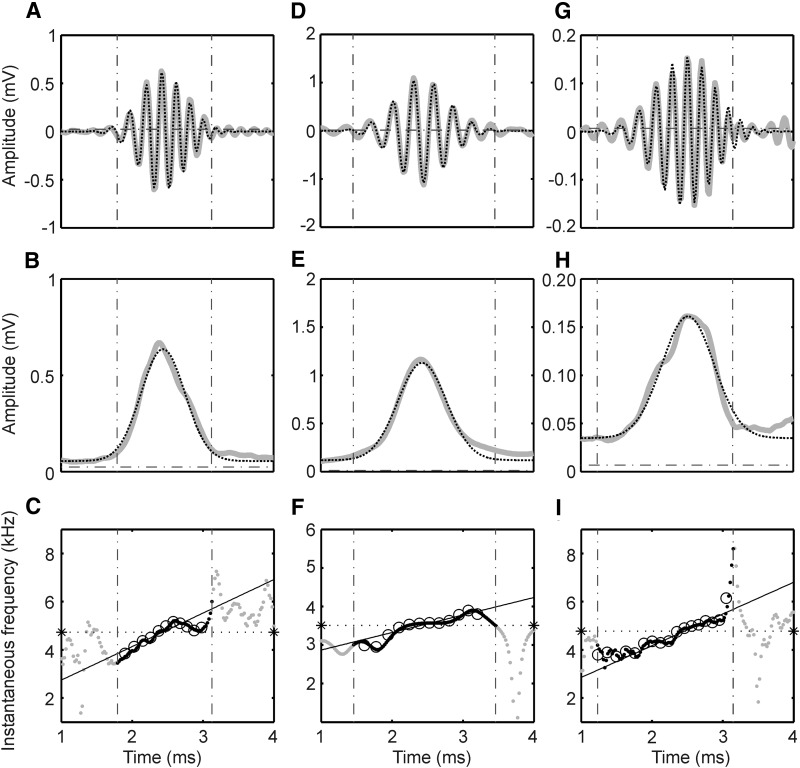
FIG. 5.
Fits of high-pass filtered click responses and instantaneous frequency. A, D, and G: fits of high-pass filtered responses (gray lines) as shown in Fig. 3, E, J, and O with Gabor-chirp functions (dotted lines). The vertical dot-dashed lines limit the time interval when the magnitude of the envelope was higher than 10% of the maximum of the envelope. The horizontal dot-dashed lines represents the mean spontaneous activity calculated during 9.56 ms before stimulus onset. B, E, and H: envelopes of the analytic signals created using the Hilbert transform (gray lines). The dotted lines are the fits with Gaussian functions as reflected in the Gabor filter. The dot-dashed lines in B, E, and H represent the mean spontaneous activity. C, F, and I: instantaneous frequencies. The black dots (within the 10% window) and the gray dots (outside) show the instantaneous frequencies from the Hilbert transformation. The open circles show the instantaneous frequencies as calculated from the 0 crossings. The solid lines denote the instantaneous frequency calculated from the Gabor-chirp fit; the stars and the horizontal dotted lines demark the instantaneous frequency at the group delay. The BFs were, A: 4,876 Hz, B: 3,450 Hz, C: 4,975 Hz.

