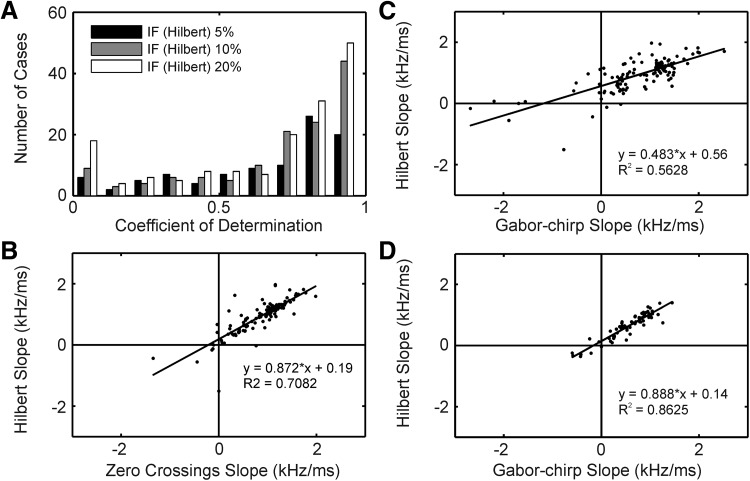
FIG. 7.
Instantaneous frequency. A: distributions of the coefficients of determination (R2) obtained from a linear regression on the instantaneous frequency (IF Hilbert) as a function of time (as in Fig. 5, C, F, and I). Distributions are shown for 3 different threshold criteria as explained in the inset. The number of cases (N) were for the 5% criterion: n = 96, for the 10% criterion: n = 132, for the 20% criterion: n = 157. B: slopes (in units of kHz/ms) of the time-dependent instantaneous frequencies. We compared slopes obtained from 0 crossings (0 crossing slope) with those obtained using the Hilbert transform (Hilbert slope). Note the close similarity of the results obtained with the 2 measures. C and D: for the 10% threshold, the Hilbert slopes were better correlated with the slopes taken from the Gabor-chirp fit (Gabor-chirp slope) if the click level was reduced by 20 dB (D, n = 65) than when maximum click level was used (C, n = 132). B–D, inset: the linear-regression equation and the coefficient of determination.

