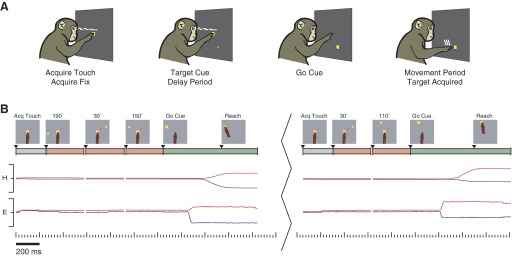
FIG. 2.

Behavioral task. A: depiction of the standard instructed-delay reach trial. B: example of 5 consecutive trials in our prosthetic cursor data set. Illustration was adapted from Santhanam et al. (2006a) (with prosthetic cursor omitted for clarity). The break between the 3rd and 4th trials constitutes an intertrial interval (500–1,200 ms) that occurs after real reaches, providing time for the monkey to receive his juice reward and return his hand to the center of the screen to start a subsequent trial. The illustrations show the monkey's arm state relative to the visual stimuli. The colored timeline below depicts the various stages of each trial: gray corresponding to the initial period of a trial before the target is shown, orange corresponding to the delay period, and green corresponding to the time after the go cue. The hand (H) and eye (E) positions are graphed throughout all 5 trials, with blue and red lines showing the horizontal and vertical coordinates, respectively. Full range of scale for these data is ±15 cm from the center touch cue. Trials were from experiment H20041106.4.
