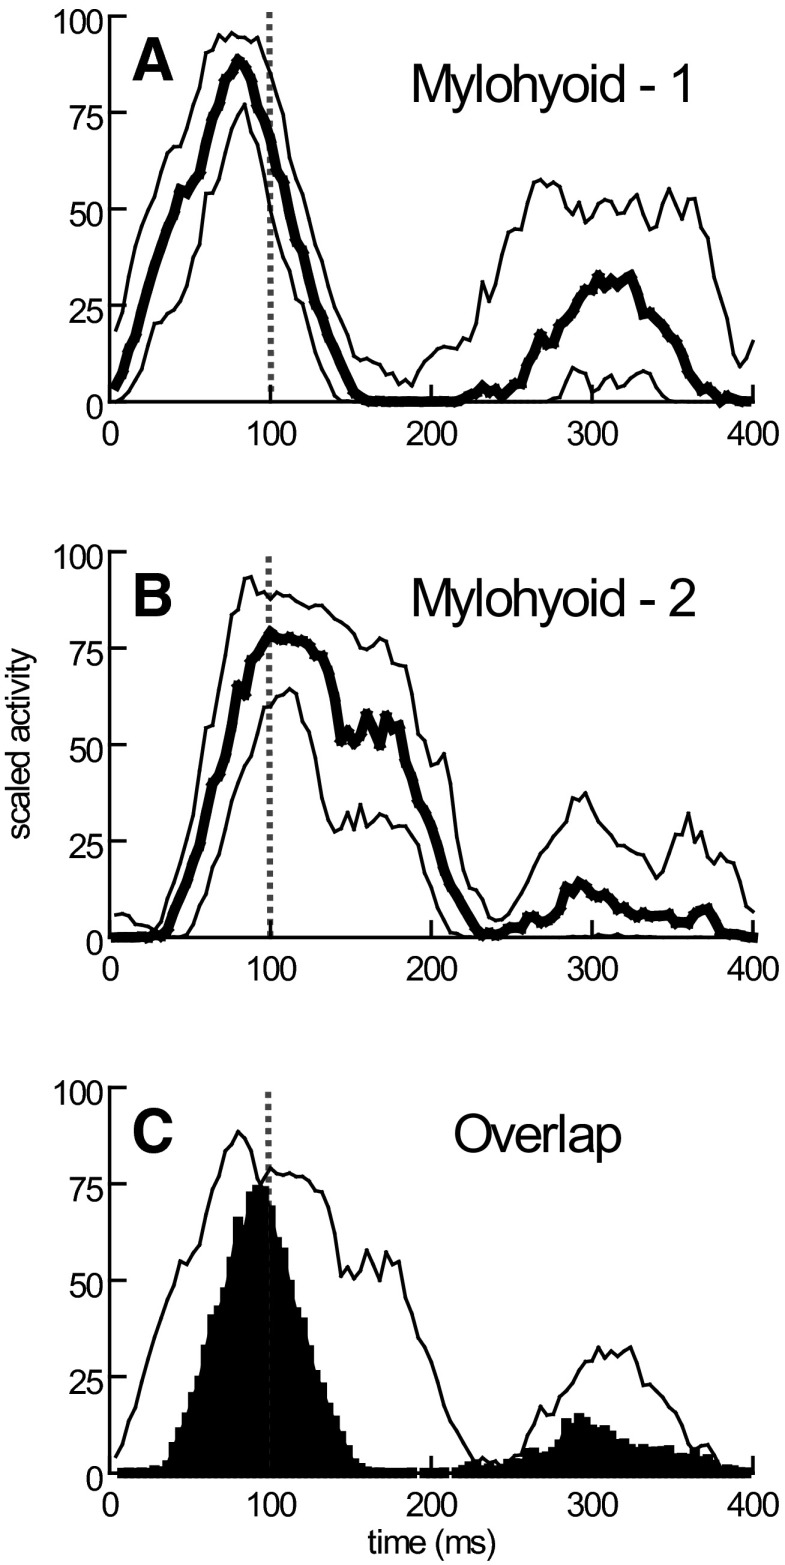
FIG. 4.
Mylohyoid EMG activity recorded by duplicate EMG patch electrodes located at 2 different sites (A and B) on the muscle. The median and quartile profiles of activity indicate both large measures of temporal variability at each site and differences between the timing of signals detected at the 2 sites. The 2 median profiles from A and B are shown in C with their temporal overlap shown in black. The common (black) area is expressed as a percentage of the total area of the 2 median profiles to obtain a measure of the similarity of timing of EMG signals at 2 sites in the same muscle.

