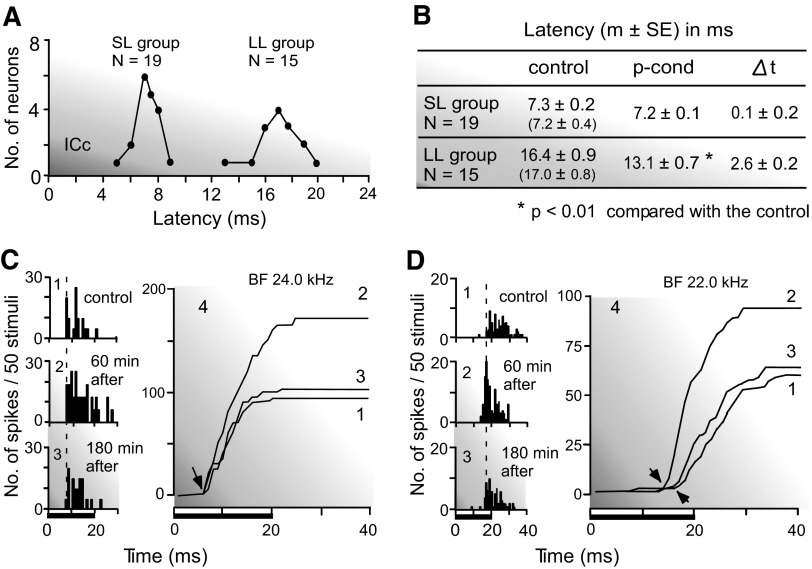
FIG. 3.
Shortening of the response latency accompanied with the augmentation of a response elicited by p-cond. A: the bimodal distribution of the latencies of collicular neurons: short (SL)- and long (LL)-latency groups. B: the means and SE of the response latencies of neurons in these 2 groups measured before and after the p-cond. The latencies in the recovered condition are shown in the parentheses. Δt: change in latency. C and D: peristimulus time (PST; 1–3) and PST cumulative (4) histograms show the responses of 2 neurons (C and D) to tone bursts delivered 50 times. The tone burst was 24.0 kHz, 35 dB SPL (C) or 22.0 kHz, 40 dB SPL (D). Its duration was 20 ms (horizontal bars at bottom). The minimum threshold of the neuron was 25 (C) or 30 (D) dB SPL. 1–3, control, 60 and 180 min after the onset of the p-cond. The arrows in C indicate no latency shift, but those in D indicate the shift.

