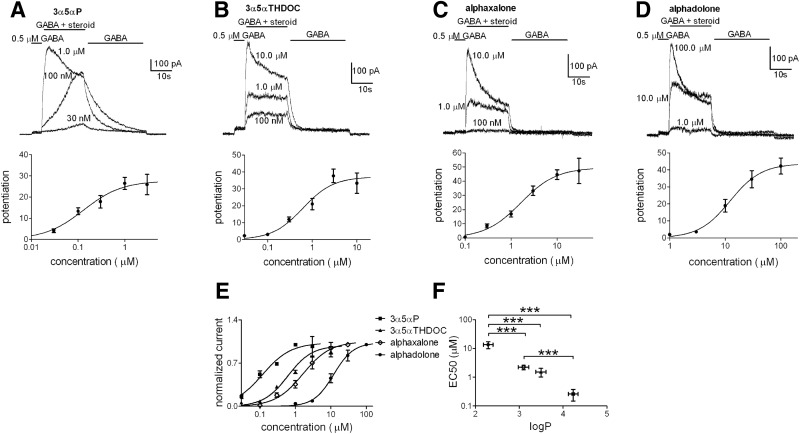
FIG. 3.
Evaluation of steroid potentiation on GABAARs in hippocampal neurons. Steroid potentiation traces (top panels) of increasing concentrations of 3α5αP (A, 0.03–3 μM, n = 11), 3α5αTHDOC (B, 0.03–10 μM, n = 16), alphaxalone (C, 0.1–30 μM, n = 17), and alphadolone (D, 1–100 μM, n = 4), applied to neuronal cultures. The concentration–response curves (A–D, bottom panels) were obtained in the presence of 0.5 μM GABA and potentiated responses were normalized to the first GABA application (see methods). For display purposes, the lines represent fits of the Hill equation to the averaged data points shown in the figure. Parameters from the summary fits for 3α5αP, 3α5αTHDOC, alphaxalone, and alphadolone, respectively, were EC50: 0.3, 1.5, 2.2, and 13.4 μM; Hill coefficient: 1.1, 1.3, 1.1, and 1.5. E: data for each steroid were normalized to the individual maximum potentiation to facilitate potency comparisons. F: the estimated EC50 values for the steroids from fits to the individual cells are shown as a function of the corresponding log P. Values are means ± SE; ***P < 0.0001 (unpaired t-test). The comparison of 3α5αTHDOC vs. 3α5αP showed a significant difference only with a one-tailed t-test (P < 0.05).

