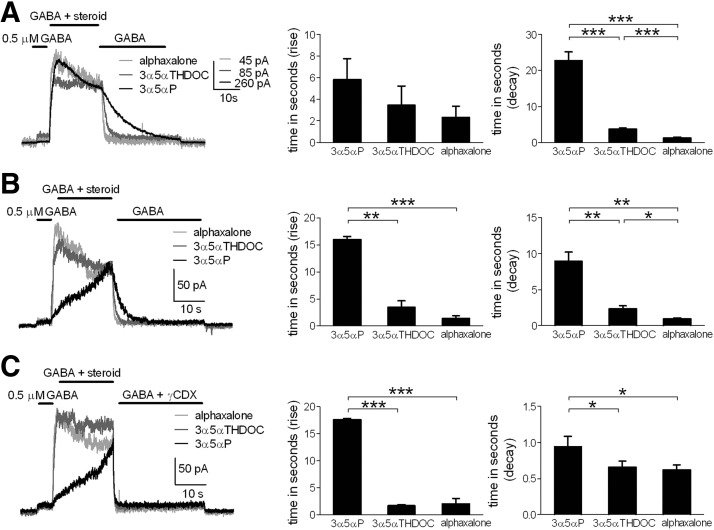
FIG. 4.
Onset and offset kinetics of different steroid analogues in neuronal cultures. A: representative traces of steroid potentiation yielded by equimolar analogue concentration (1 μM). Compounds were coapplied with GABA (0.5 μM) after a GABA preapplication. Comparisons of 10–90% rise and decay times are shown (bar diagrams). Values are means ± SE (3α5αP, n = 5; 3α5αTHDOC, n = 6; alphaxalone, n = 7); ***P < 0.0001 (unpaired t-test). There was no statistical difference in rise time among the 3 analogues at 1 μM. B: representative traces of steroid potentiation determined by EC20 analogue concentration (0.05 μM, 3α5αP; 0.3 μM, 3α5αTHDOC; 0.85 μM, alphaxalone). Comparisons of rise and decay times are shown (bar diagrams). Values are means ± SE (n = 5); *P < 0.05, **P < 0.01, ***P < 0.0001 (paired t-test). C: representative traces of steroid potentiation determined with EC20 concentration (0.05 μM, 3α5αP; 0.3 μM, 3α5αTHDOC; 0.85 μM, alphaxalone). Potentiation removal was determined by coapplication of 500 μM γCDX with 0.5 μM GABA. Comparisons of mean rise and decay times are shown (bar diagrams). Values are means ± SE (n = 6); *P < 0.05, ***P < 0.0001 (paired t-test).

