FIG. 9.
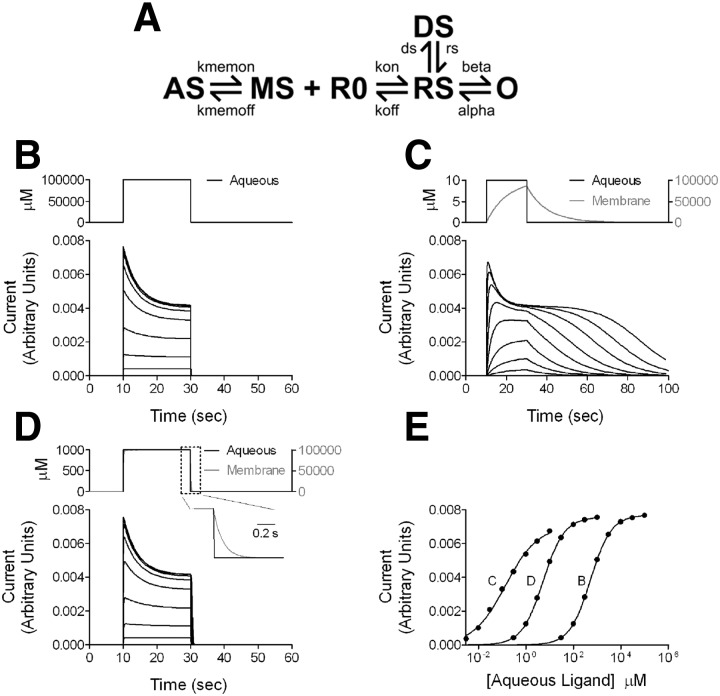
Simulations of conventional aqueous ligand access vs. membrane access to a receptor. A: kinetic scheme for the simulations. See Supplemental text and Supplemental Table S1 for details of the simulation parameters, including rationale and constraints. AS, aqueous steroid ligand; MS, membrane steroid; R0, unbound receptor; RS, ligand bound receptor; O, open channel; DS, a liganded desensitized state. Binding parameters (kon, koff) were set to simulate a low-affinity receptor. Only the open state is conducting. B: simulations of a conventional receptor responding to aqueous ligand application. In the context of the scheme shown in A, this was implemented by setting Kmem on and Kmem off to equal values, more rapid than other rate constants in the scheme. The bottom panel shows simulated current responses to a 20-s pulse of aqueous concentrations of applied agonist (concentration range, 30 μM to 100 mM). The top panel shows aqueous agonist concentration profile for the largest response. C: simulated current responses of a membrane receptor to aqueous application of agonist with a log P of 4 (aqueous concentration range, 0.03–3 μM). Membrane accumulation and departure rates were based on observations from fluorescent steroids; values are given in the Supplemental text. The concentration traces represent aqueous (black) and membrane (gray) concentrations for a 20-s pulse application of 10 μM aqueous ligand, the highest concentration simulated. Note that the asymptotic membrane concentration exceeds the aqueous concentration by 4 orders of magnitude. D: the simulation was repeated with membrane departure rate sped 100-fold relative to the simulation in C and D to simulate a ligand with log P of 2 (aqueous concentration range, 0.3–1,000 μM). Concentration traces again represent the highest concentration simulated (1,000 μM aqueous). The inset shows the boxed region and shows the difference between the time courses of aqueous and membrane concentration on aqueous ligand removal. E: concentration–response curves for peak responses from the data in B–D. The letter associated with each curve represents the relevant panel letter. The solid lines represent fits to the Hill equation. For the data in B (receptor for aqueous ligand), the potency (EC50) estimate from the fit was 519.4 μM, with a Hill coefficient of 0.99. For the data in C (membrane receptor, ligand log P = 4), the EC50 from the fit was 0.14 μM, with a Hill coefficient of 0.64. For the data in D (membrane receptor, ligand log P = 2), the fit yielded an EC50 of 5.26 μM and a Hill coefficient of 0.97. Note that the dramatic shifts in EC50 were effected with no change in ligand binding or dissociation constants, kon and koff.

