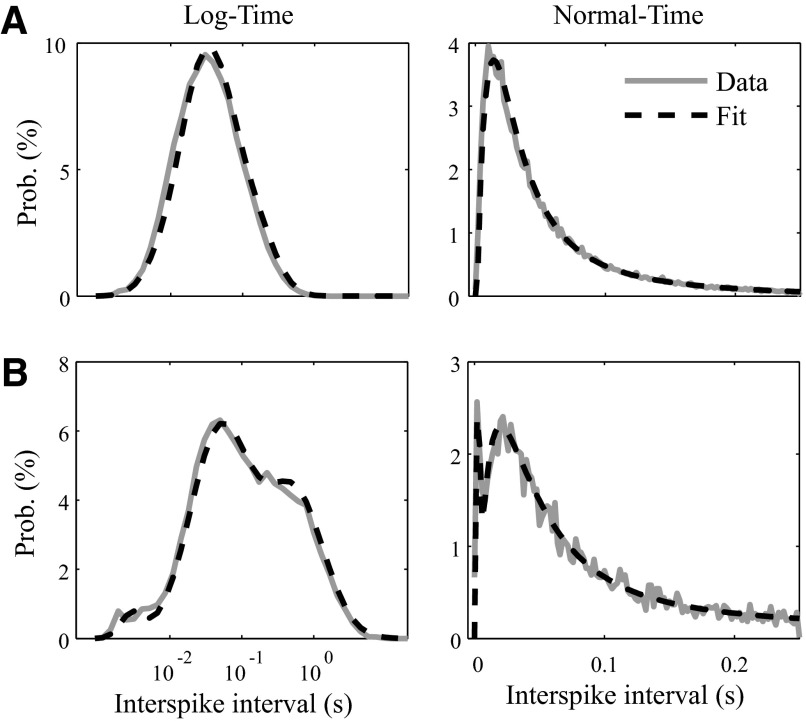
FIG. 1.
A mixture of 3 log-normals fits the interspike interval histograms (ISIHs) of 2 example neurons (A, top; B, bottom). Raw ISIHs are displayed in gray, whereas the fit traces are displayed in black, dashed lines. ISIHs are displayed both in normal time (right) and log-time (left). Note that the ISIH in B requires a mixture of 3 log-normals for a good fit, whereas the ISIH in A seems to be well fit with a single log-normal distribution (the expectation–maximization algorithm set the mixing probabilities of the other 2 log-normals close to zero).

