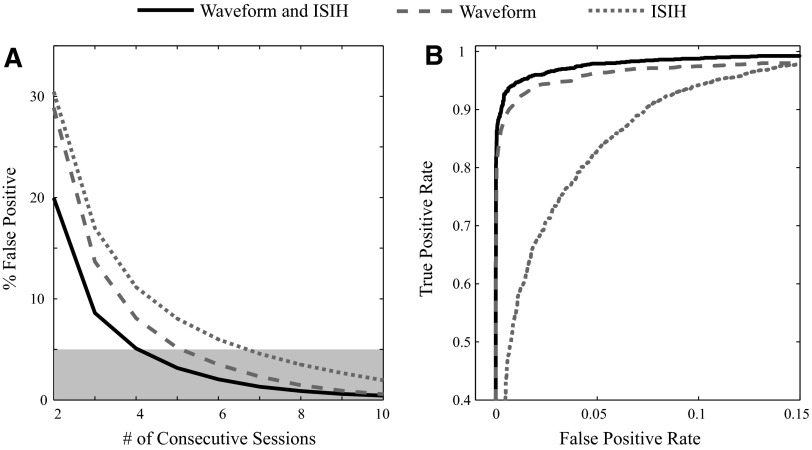
FIG. 10.
Using both waveform and ISIH data reduces false positives. A: the estimated false-positive rate, which is the percentage of units of the “true negatives” deemed to be stable through a given number of sessions, is less when using both waveform and ISIH data (solid black trace) than when using just waveform data (dashed gray trace) or just ISIH data (dotted gray trace) alone. The 5% significant level is also indicated (light gray box). The number of consecutive electrodes is used as a proxy for the number of sessions. B: the area under the receiver operating characteristic curve (a measure of classification performance) is higher when using both waveform and ISIH data then when using just waveform or just ISIH data alone. The differences in the area under the curves were found to be statistically significant (see text for details).

