FIG. 10.
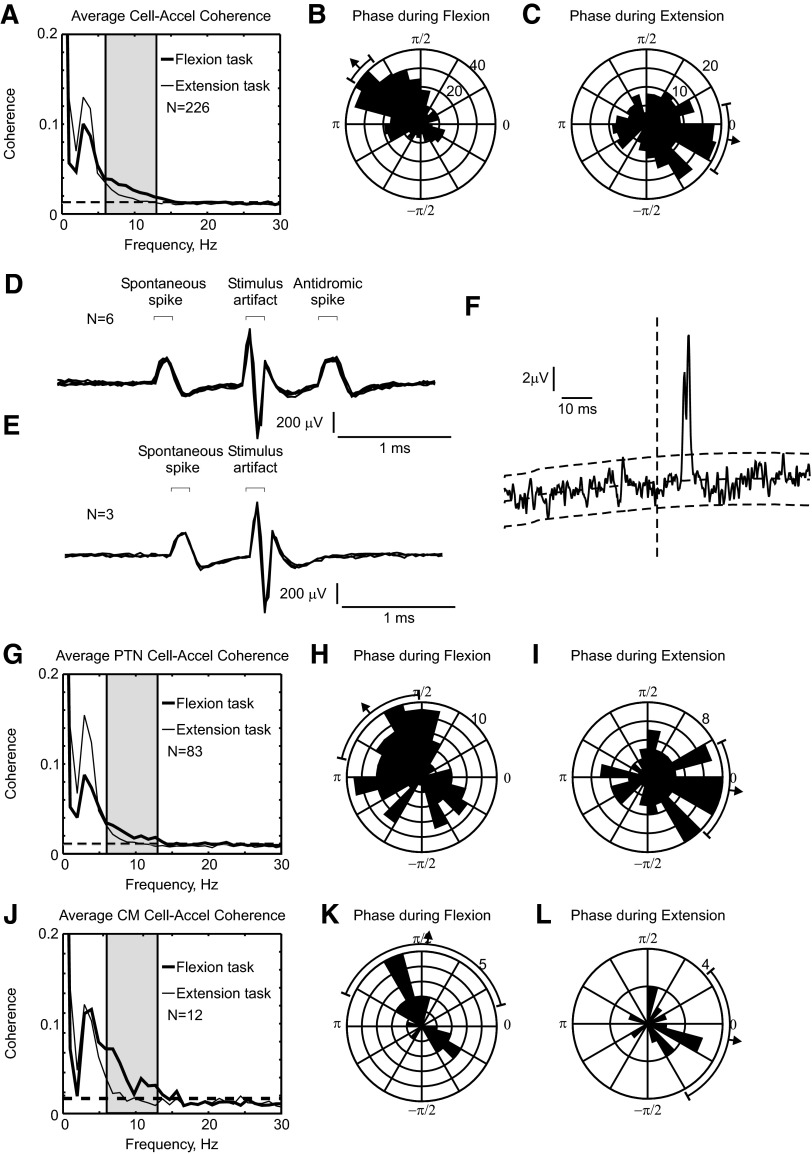
Average coherence between all cells, pyramidal tract neurons (PTNs), corticomotoneuronal (CM) cells, and acceleration. A: averaged coherence between spikes from all available cells and finger acceleration, calculated separately for flexion and extension trials (thick vs. thin lines). B and C: corresponding coherence phase distribution for flexion (B) and extension trials (C) for the 6- to 13-Hz range. D: antidromic response of cell to PT stimulation (500 μA). Stimulus was delivered 0.8 ms after a spontaneous spike. E: shortening the trigger interval to 0.7 ms resulted in collision of the antidromic spike, identifying the cell as a PTN. F: spike-triggered average of rectified EMG from the 1DI muscle, triggered by the spikes of cell shown in D and E. Dotted lines show baseline estimate, produced by convolving the average with a Gaussian kernel (width parameter 50 ms), and the 95% confidence limits on the baseline. n = 142413 trigger spikes. G–I: like A–C, but only using identified PTNs. J–L: like A–C, but only using identified CM cells. Bars outside circular histograms show mean phase and 95% confidence limits on this mean.

