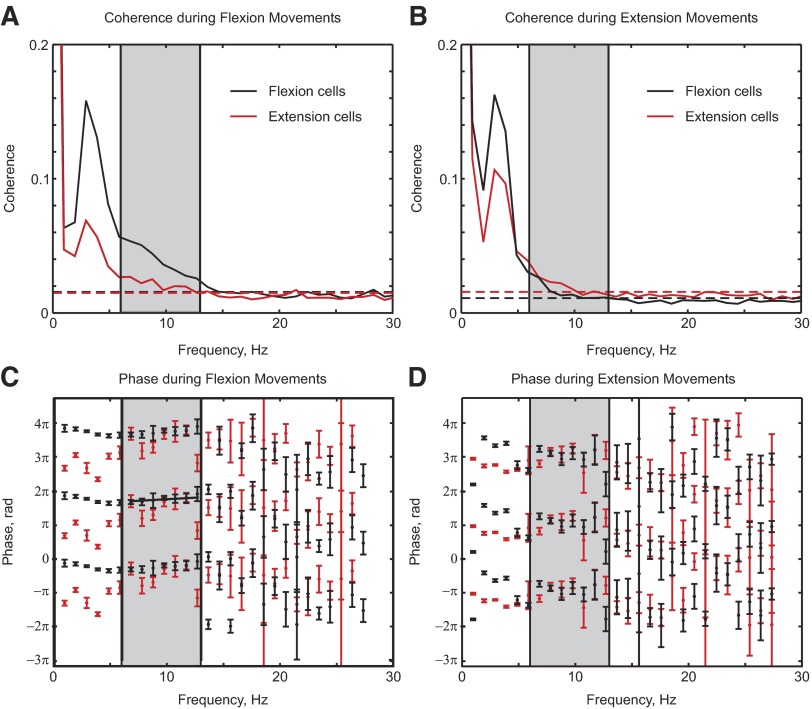
FIG. 9.
Average coherence between cells and acceleration. A and B: average coherence between cell spiking and acceleration, for flexion cells (black) and extension cells (red). Results are plotted for flexion ramp phase (A) and extension ramp phase (B). Averages were compiled over all available cells from both monkeys. C and D: circular mean coherence phase corresponding to A and B.

