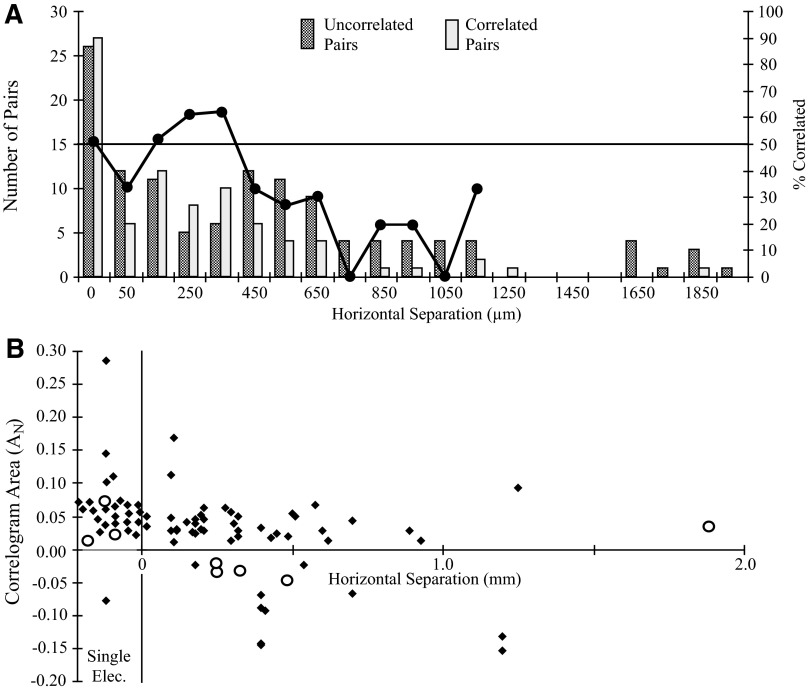
FIG. 10.
A: distribution of correlated (light stipple) and uncorrelated (heavy stipple) cell pairs by horizontal separation along layer V. The superimposed line plots the percentage of correlated pairs within each 100-μm division (right ordinate). Fifty-one percent of pairs recorded on the same electrode (0 mm) were correlated and >50% of cell pairs separated by 100–400 μm were correlated. No correlated pairs were found beyond 1,890 μm (6 uncorrelated cell pairs were separated by distances between 2.0 and 3.8 mm; data not shown). B: relation between normalized correlogram area (AN) and horizontal separation between paired cells. Cells recorded on the same electrode are shown below abscissa values of 0. Central features (peaks, lagged peaks and troughs) are plotted as solid diamonds. Lagged peaks and lagged troughs are plotted as open circles.

