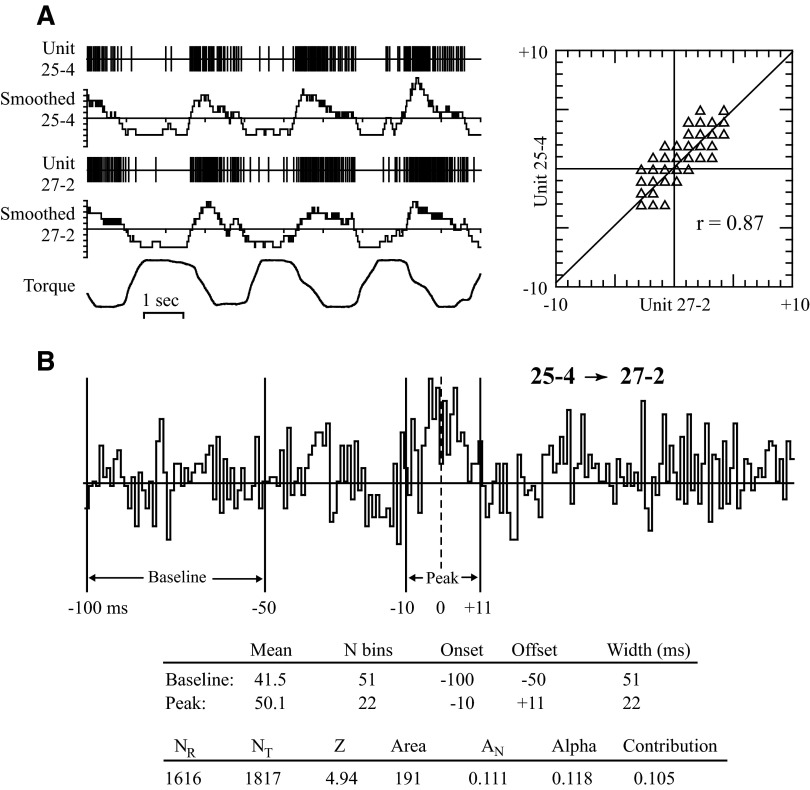
FIG. 2.
A: calculation of response similarity (r), measuring the strength of covariation in firing rates of 2 precentral cells during active wrist torque generation. The digitized spike trains of 2 neurons (units 25-4 and 27-2) and wrist torque are shown for 10 s of data. The units' firing rate is smoothed by summing the number of spikes within a moving 200-ms window as shown in the “smoothed” traces. Response similarity is calculated as the correlation coefficient between the 2 smoothed signals, shown in the scatterplot on the right (r = 0.87). Torque signal: flexion upward, extension downward. B: determination of onset, offset, and size of correlogram feature. Baseline was defined as the first 50 bins of the correlogram, onset, and offset as the middle bin of a 3-bin average that exceeded this baseline (for peaks) or fell below (for troughs). Area is the sum of counts above or below baseline between onset and offset; AN is the feature area divided by (NR + NT)/2, where NR is the number of reference cell triggers and NT is the number of target cell triggers. Features with |Z| >2.8 were accepted as significant (Cope et al. 1987). Numerical measures for this example are tabulated. α = AN/NT; contribution = AN/NR.

