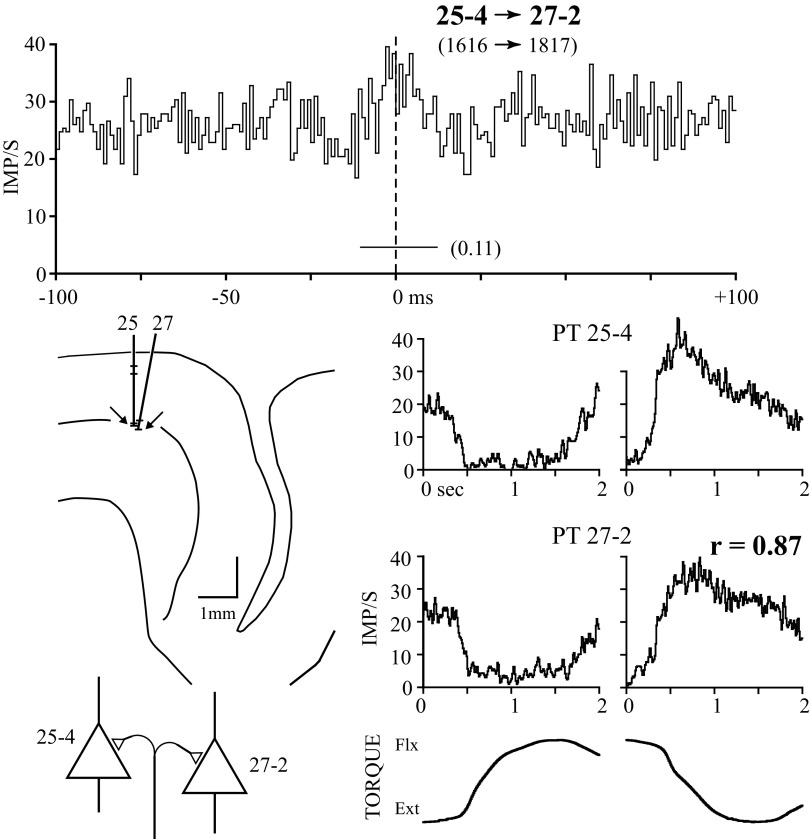
FIG. 3.
Cross-correlogram, response averages, histological location, and inferred synaptic connectivity between 2 pyramidal tract (PT) cells recorded on independent electrodes. Figures 5 through 8 follow the same format. The correlogram (top) is between cells 25-4 and 27-2 (1-ms bin width). Cell 25-4 is reference and the number of reference and target cell spikes is given in parentheses. The horizontal line below the peak indicates the time span of significant correlation and feature area (AN) is given to the right. The ordinate is scaled in frequency (bin count divided by the product of bin width and number of sweeps). Bottom right traces are response averages of unit activity and wrist torques aligned to the onset of flexion and extension ramp-and-hold torques. Zero wrist torque is approximately midway between flexion and extension torques. The reference cell's response average is on the top and the target cell's is on the bottom. Response similarity (r) is shown above the reference cell's extension average. Histological locations of recorded cells are shown in the middle left panel. The precentral gyrus is to the left of the central sulcus, the pial surface is represented by the solid line, the center of layer V by the middle line, and the gray–white junction by the lowest line. Individual cells recorded on electrode tracks 25 and 27 are indicated by horizontal lines with arrows indicating cells 25-4 and 27-2. Scale bar = 1 mm. The schematic at the bottom left represent 2 PT cells (open triangles) with common synaptic drive. In subsequent figures, non-PT (NPT) cells are represented as circles and corticomotoneuronal (CM) cells as filled triangles.

