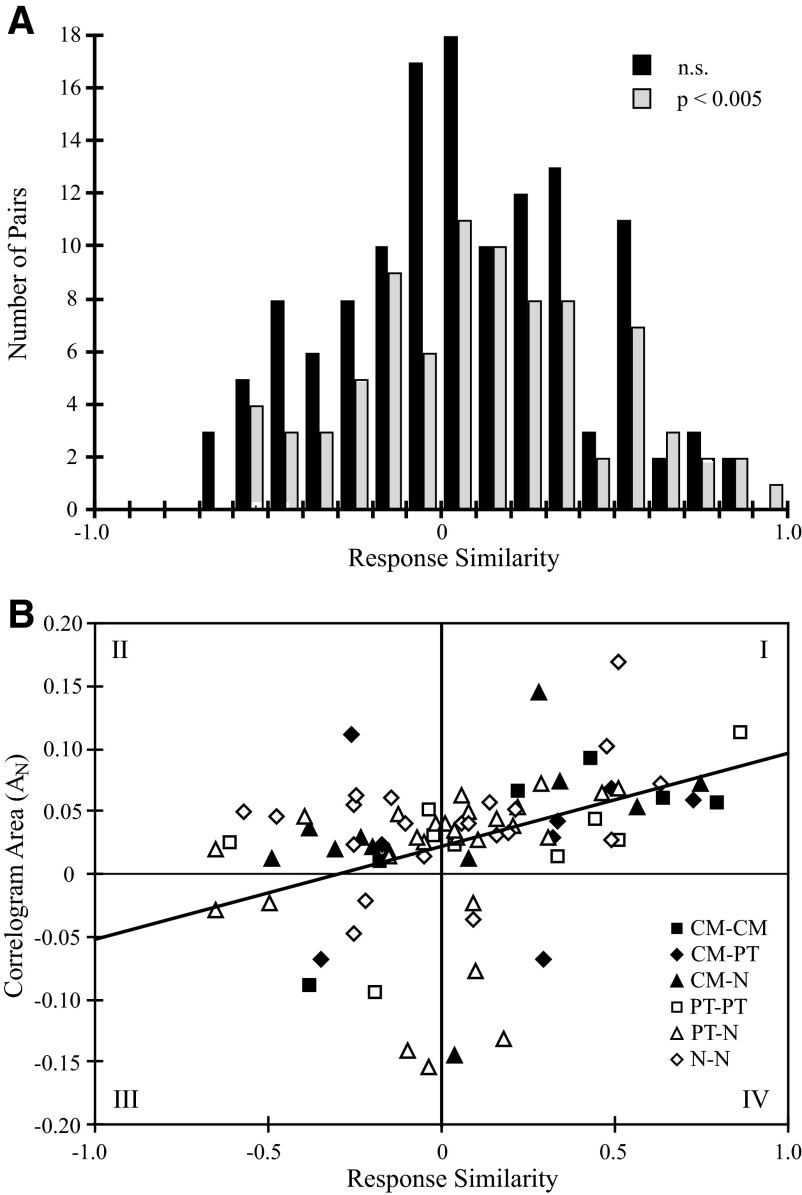
FIG. 8.
A: distribution of response similarity values for all cell pairs (n = 215). Similarity values for cell pairs with significant correlogram features (P < 0.005; stipple) do not differ in distribution from cell pairs with no significant correlogram features (black). B: relationship between correlogram area (AN) and response similarity for all significant correlograms (n = 84). Data points are divided into 6 categories depending on cell types. The graph is divided into 4 quadrants indicated by roman numerals (I–IV). Quadrants I and III represent regions where cells with similar response properties had peaks in the correlogram and cells with reciprocal response properties that had troughs in the correlograms, respectively. Cell pairs with peaks in the correlogram but reciprocal response properties fell in quadrant II and cell pairs with correlogram troughs and similar response properties fell into quadrant IV. Correlation coefficient of regression line is 0.410 (P < 0.001, df = 82).

