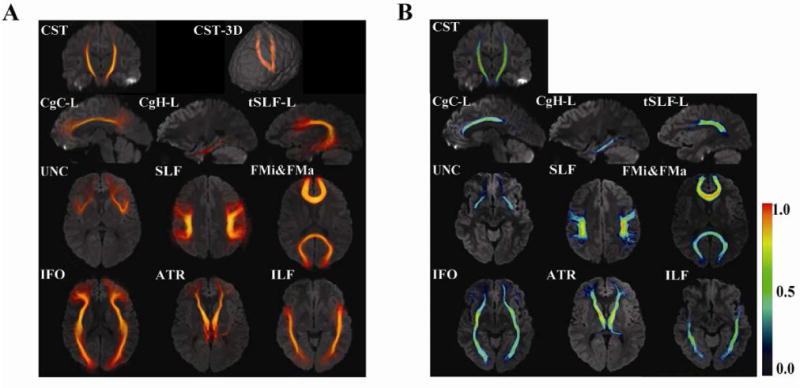
Fig. 3.

Probabilistic maps of 11 white matter tracts. Results are superimposed on a single-subject JHU template. The 3D volume rendering of the averaged tract (A) and color-scaled probabilistic maps (B) are superimposed on 2D slices. Maximum intensity projection is used for the color intensity in (A). The color in (B) represents probability, as shown in the color bar.
