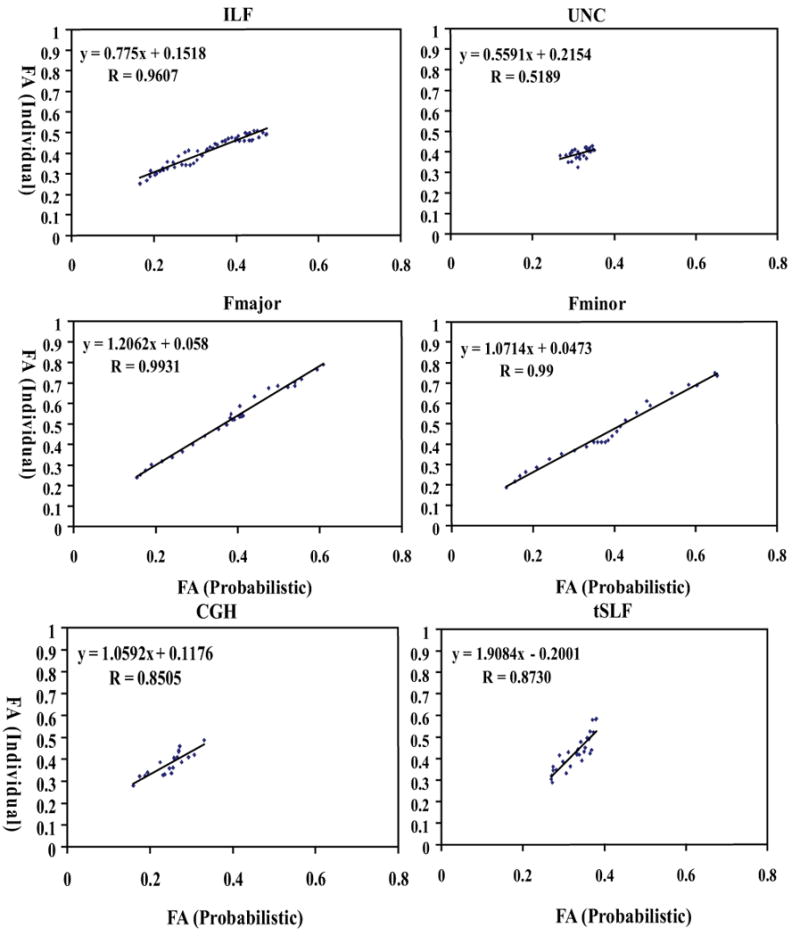
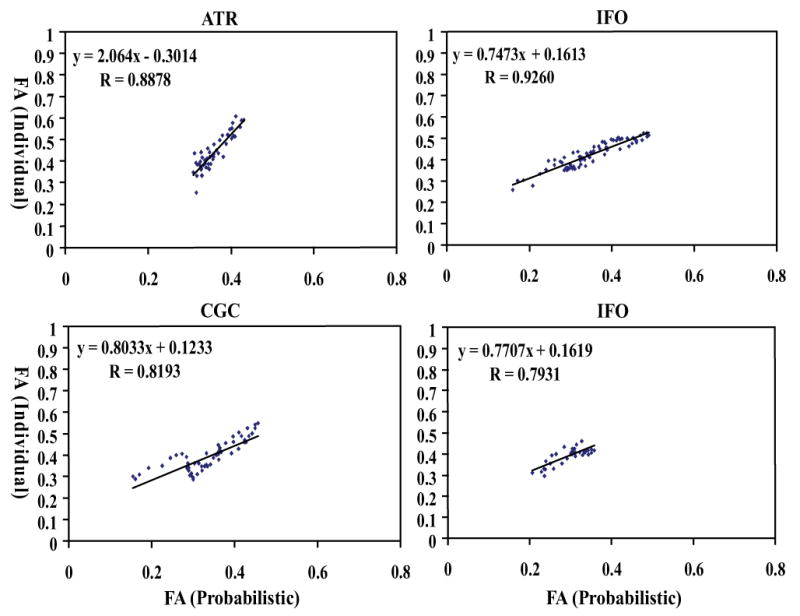
Fig. 6.


Pearson correlation analysis of probabilistic method (X axis) and individual method (Y axis) for FA measurements of 10 fiber tracts. All the correlation coefficients are greater than 0.82, except for UNC and SLF.


Pearson correlation analysis of probabilistic method (X axis) and individual method (Y axis) for FA measurements of 10 fiber tracts. All the correlation coefficients are greater than 0.82, except for UNC and SLF.