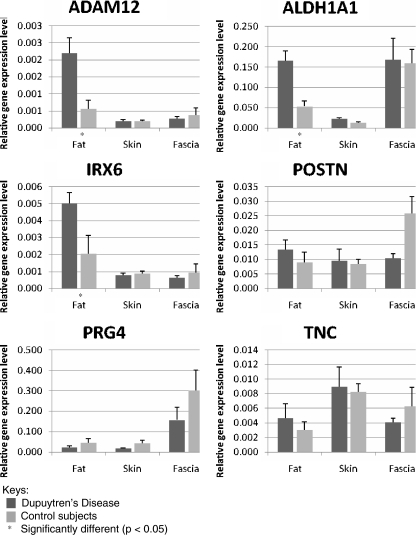
Figure 3.
Relative gene expression in each sample. The relative gene expression levels, obtained by normalizing candidate gene expression levels to reference genes, were obtained from quantitative polymerase chain reactions. The dark-colored bars represent the data for Dupuytren’s disease samples, and the light colored bars represent the data for control samples. Statistically significant (p < 0.05) differential gene expression for ADAM12, ALDH1A1, and IRX6 were observed in DD fat, which are marked with asterisk in the graphs. ADAM12 A disintegrin and metalloproteinase domain; ALDH1A1 aldehyde dehydrogenase 1 family member; IRX6 iroquois homeoboxprotein 6; PRG4 proteoglycan 4; TNC tenascin C; POSTN periostin, osteoblast specific factor. The CT values for DD fascia (n = 4) were previously published in Shih et al. [39].

