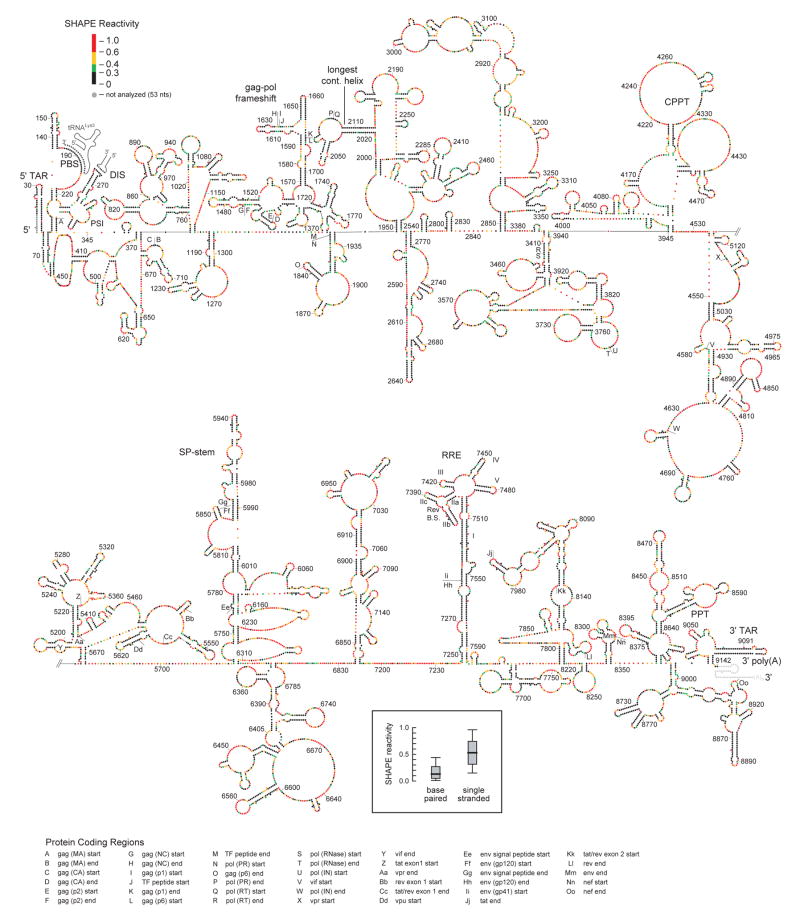
Figure 2.
Structure of the HIV-1 NL4-3 genome. The 5′ and 3′ genome halves are shown in panels (a) and (b). Nucleotides are colored by their absolute SHAPE reactivities (see scale in panel a). Every nucleotide is shown explicitly as a sphere; base pairing is indicated by adjacent parallel orientation of the spheres. Protein domains are identified by letters. Important structural landmarks are labeled explicitly. Full nucleotide identities and pairings are provided in the supplementary information (Fig. S7). Intermolecular base pairs involving the tRNALys3 primer and the genomic dimer are shown in gray. Inset shows a box plot illustrating SHAPE reactivities for single stranded versus paired nucleotides in the model. Median reactivities are indicated by bold horizontal lines; the large box spans the central 50% of the reactivity data.

