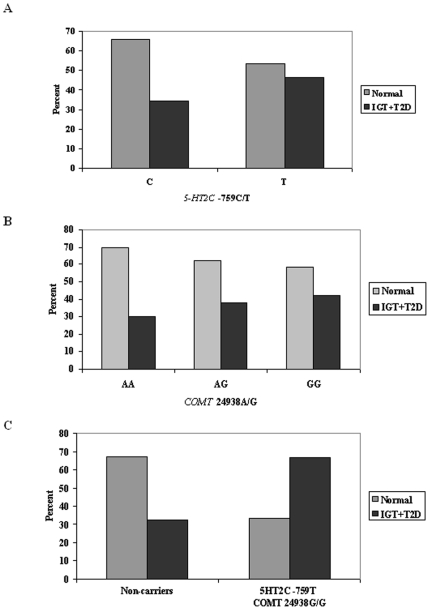
Figure 1. Frequency of IGT or T2D according to 5HT2C –759C/T, COMT 24938A/G and combined genotype analysis in the combined group of obese and randomly selected men.
Values are given as percentages. A: Frequency of IGT or T2D according to 5HT2C –759C/T. B: Frequency of IGT or T2D according to COMT 24938A/G. C: Frequency of IGT or T2D according to combination of 5HT2C –759C/T T-allele and COMT 24938A/G GG-genotype. A: P-value for χ2 = 0.05, B: P-value for χ2 = 0.06, C: P-value for χ2 = 0.01.

