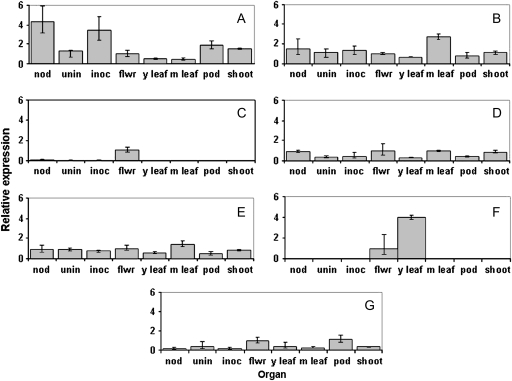
Fig. 3.
Relative transcript levels of N/A invertases in different plant organs. Analysis by qRT-PCR of LjINV1 (A); LjINV2 (B); LjINV3 (C); LjINV4 (D); LjINV5 (E); LjINV6 (F); and LjINV7 (G) in nodules (nod), uninfected roots (unin), rhizobium-inoculated roots (inoc), flowers (flwr), young leaves (y leaf), mature leaves (m leaf), pods (pod), and shoots (shoot). Values are means ±SD from three individual plants. Transcript levels were expressed relative to the level in flowers after normalization to the levels of LjEF-1α. Note comparisons are within transcripts representing individual isoforms in different organs and the asymmetrical distribution of the SD caused by the conversion of the exponential process into a linear comparison (Livak and Schmittgen, 2001).

