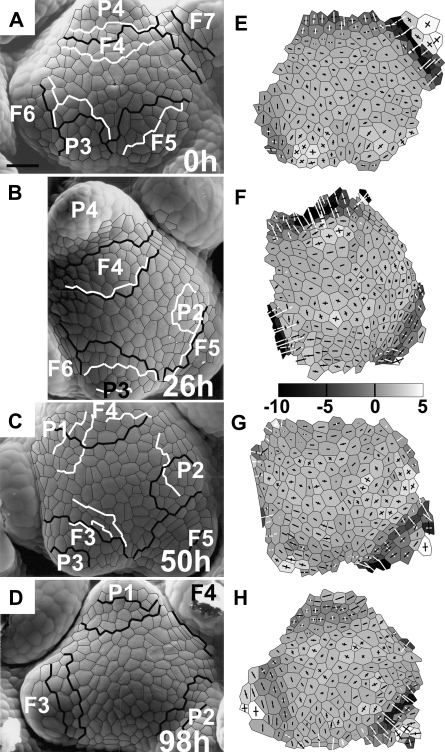
Fig. 1.
The developmental sequence of an inflorescence shoot apex of Anagallis arvensis illustrating all the stages of the development of the bract primordium (primordium labelled as P3) and the flower primordium emerging in its axil (F3). Scanning electromicrographs (A–D) and curvature plots (E–H) are shown for the sequence of four replicas. The time at which the replica was taken is given in the lower right corner of each micrograph. Bract primordia are labelled with P and a number (the younger the primordium, the lower the number). The flower primordium emerging in the axil of P is labelled by an F with the same number as the P. Each primordium has the same number for the whole sequence of replicas so that a given primordium can be easily followed in consecutive images. Cells used for curvature computation are outlined in black in the micrographs. Gaussian curvature is shown in grey-scale maps, while crosses represent curvature directions. The black cross arm points to the direction in which the surface is convex; the white cross arm to the direction in which it is concave. Arm length is proportional to curvature in the given direction. The scale for Gaussian curvature is in 10−4 μm−2. Lines overlaid on micrographs show adaxial boundaries of bract or flower primordia, recognized on the basis of curvature. Black lines are boundaries between the SAM and primordia recognized on curvature plots of the given replica; white lines are boundaries recognized on the curvature of the next replica. The boundary is described by two lines if it is the region of nil (e.g. boundary of P3 in C, G) or negative (e.g. boundary of F3 in D, H) Gaussian curvature. Bar=30 μm.

