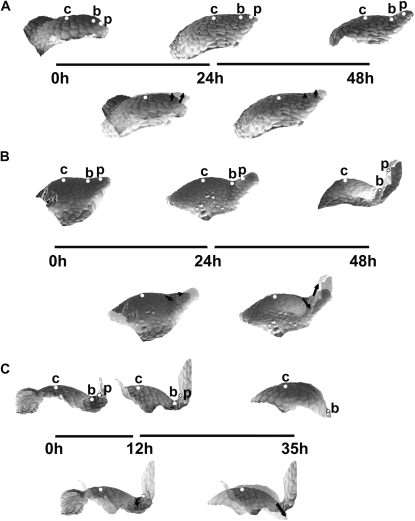
Fig. 4.
Sequences of 3D reconstructions of replicas taken from three individual shoot apices of Anagallis arvensis in the vegetative developmental phase, representing consecutive stages of leaf primordium development: initial bulging, lateral expansion, and separation stages (A); the separation stage followed by the early stage of primordium curving (B); further curving of the primordium (C). Images in the upper rows of A, B and C are side views of the reconstructed apex surface obtained from consecutive replicas. The time at which the replicas were taken is given below each reconstruction; the length of line segments between the reconstructions is proportional to the time interval between the consecutive replicas. White dots labelling the profiles point to these same cells recognized on the replicas: c is the cell on the top of SAM; b is the cell at the boundary between the meristem and leaf primordium; and p is the cell on the primordium tip or flanks. Images below the ‘time segments’ are the two consecutive reconstructions overlaid using the protocol described in the text. Arrows connect the positions of each dot in the two overlaid profiles, thus pointing to the displacement directions.

