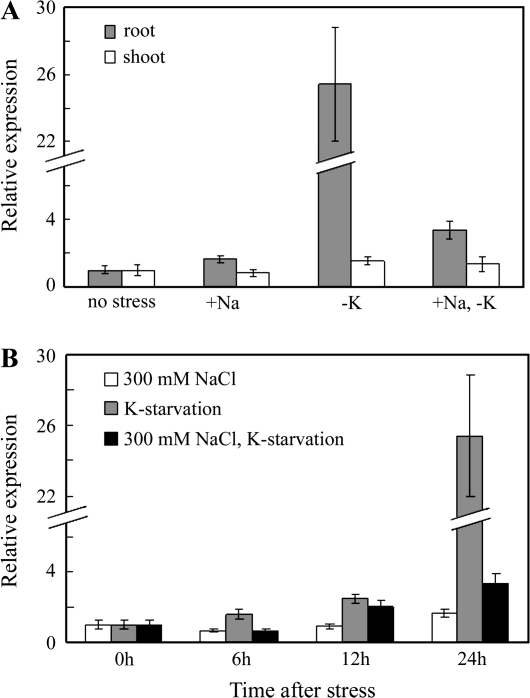
Fig. 4.
(A) Expression analysis of PutHKT2;1 by means of real-time RT-PCR in roots and shoots of P. tenuiflora subjected to 300 mM NaCl (+Na), K+-starvation (–K), and both 300 mM NaCl and K+-starvation stresses (+Na, –K) for 24 h. (B) Time-course expression analysis of PutHKT2;1 in roots of P. tenuiflora. Results are expressed as means ±SE (n=3).

