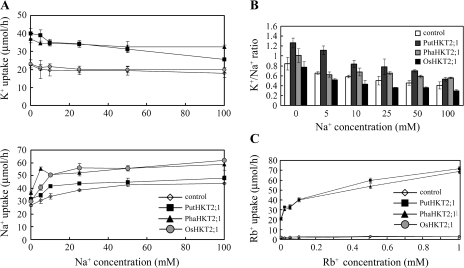
Fig. 6.
(A) Concentration dependence of K+ uptake (upper panel) or Na+ influx (lower panel) in yeasts expressing HKT2;1 of P. tenuiflora, reed plant, or rice in the presence of 5, 10, 25, 50, 100 mM NaCl, and 50 μM KCl. Strain 9.3 yeast cells were transformed with empty vector pAUR123 (open diamonds) or with the vector containing PutHKT2;1 (closed squares), PhaHKT2;1 (closed triangles) or OsHKT2;1 (grey circles) cDNA. (B) K+/Na+ ratio of yeasts cells transformed with empty plasmid (open bar) or with plasmid containing PutHKT2;1 (dark-grey bar), PhaHKT2;1 (light-grey bar) or OsHKT2;1 (black bar) cDNA treated as in (A). (C) Concentration dependence of Rb+ uptake in yeasts expressing HKT2;1 of P. tenuiflora, reed plant, or rice. Yeast strains and symbol are indicated as in (A). Results are expressed as means ±SE (n=3).

