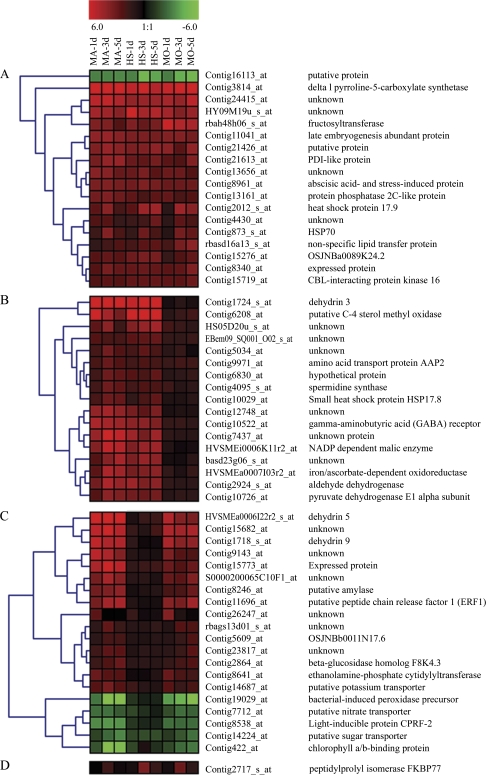
Fig. 3.
Expression changes and cluster analysis of groups of genes which were differentially expressed between control and drought stress conditions in all three genotypes (Group A), in Martin and HS41-1 (Group B), in Martin and Moroc9-75 (Group C), and in HS41-1 and Moroc9-75 (Group D). Cluster analysis for each group of genes was performed using hierarchical clustering of Genesis 1.5 with average linkage and Euclidian distance measurement. Rows represent differentially expressed genes, while columns represent the genotypes with time-course (1, 3, and 5 d) of drought treatment in which MA, HS, and MO indicate Martin, HS41-1, and Moroc9-75, respectively. Red, green, and black boxes represent genes that increased, decreased, and had equal expression levels at time points after withholding water, respectively. The contig ID and annotation of each gene are listed on the right of the figure, and the cluster numbers are listed on the left.

