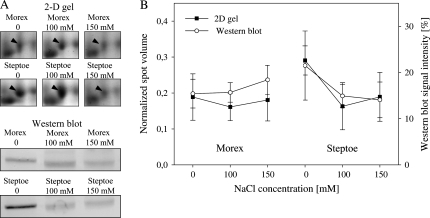
Fig. 7.
Estimated protein abundance of catalase (689) based on 2-D gel electrophoresis and western blot analysis. (A) Protein expression in one biological experiment using 2-D gel electrophoresis and immunoblotting. (B) Normalized spot volume as revealed by 2-D gels, and western blot signal intensity determined by densitometric measurement of western blot bands. Error bars show the standard deviation of measurements based on three independent biological experiments.

