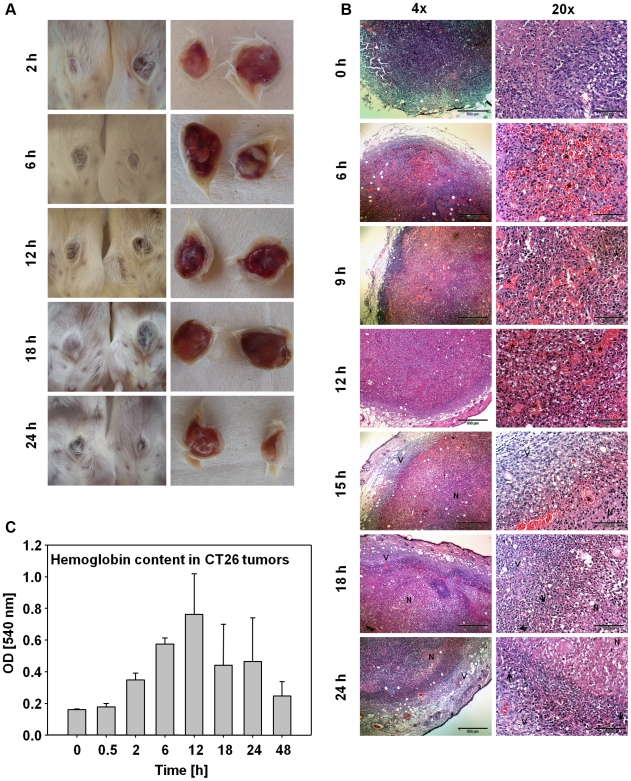
Figure 2. Time course of blood influx into CT26 tumors after bacterial infection.
(a) Photographs of CT26 tumors at different time points p.i. with S. Typhimurium. (a left) Photographs of the fur side of the tumors. (a right) Photographs of the ventral side of the tumors. (b) HE-stained paraffin sections of CT26 tumors at different time points p.i. with S. Typhimurium. (b left) Low magnification overviews. (b right) Higher magnifications of the tumors shown in (b left). 6 h–12 h: High magnifications of erythrocyte-containing (stars) central tumor areas. 15 h–24 h: High magnifications of the transition between developing necrosis (N) and remaining vital tumor rim (V). Arrows point exemplarily at neutrophils. Black bars correspond to 500 µm in (b left) and 100 µm in (b right). (c) Hemoglobin content in CT26 tumors at different time points p.i. with S. Typhimurium. Bars show standard deviations of means. Experiments were repeated three times with identical results.

