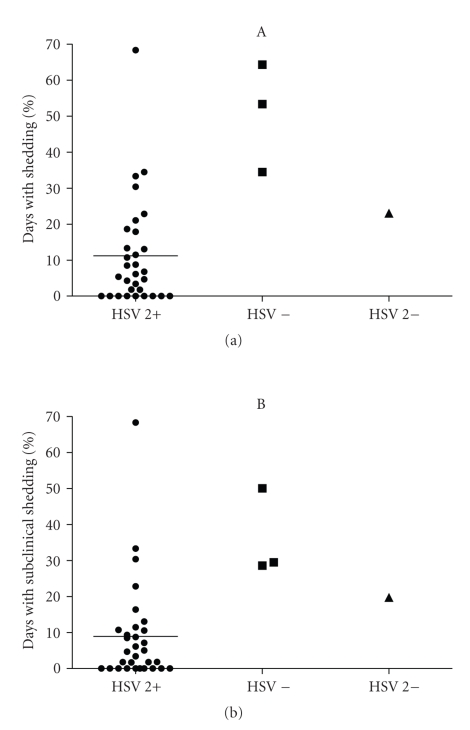
Figure 1.
Scatter plot of shedding data for subjects receiving placebo in the first treatment period. The column labeled HSV-2 + shows data from subjects whose HSV-2 antibody test was positive at enrollment (n = 31). The horizontal line represents the mean value. The next column shows the individual values for the 3 subjects who were negative for both HSV-1 and HSV-2 antibody; the next column shows the one subject who was HSV-1 antibody positive and HSV2 antibody negative at enrollment. (a) Total HSV-2 shedding, and (b) subclinical shedding.

