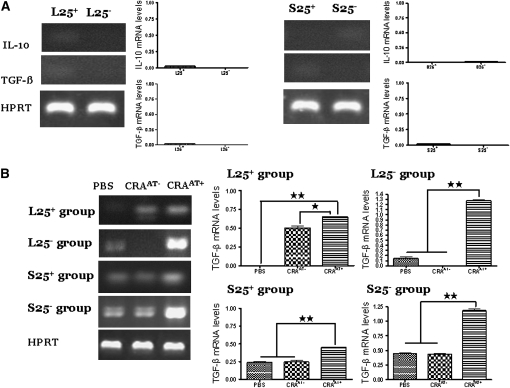
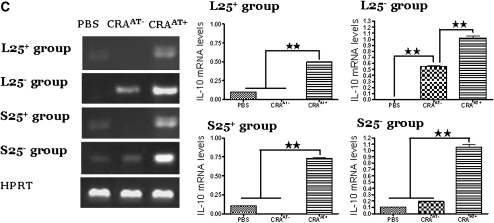
Figure 8.
Expression of TGF-β (400 bp) and IL-10 (610 bp) mRNA transcripts in lung CD4+CD25+ donor cells and in lung CD4+CD25+ cells post adoptive transfer. (A) Donor cells: The cells in the lung naturally occurring CD4+CD25− T-regulatory cells (L25+) and lung inducible CD4+CD25− T-regulatory cells (L25−) groups expressed low to undetectable levels of IL-10 and TGF-β mRNA transcripts. The cells in the spleen inducible CD4+CD25− T-regulatory cells (S25−) group expressed low levels of IL-10 and undetectable levels of TGF-β. The cells in the spleen naturally occurring CD4+CD25− T-regulatory cells (S25+) group expressed low levels of TGF-β and undetectable levels of IL-10. (B) Expression of TGF-β mRNA transcripts in post adoptive CD4+CD25+ T cells: The cells of cockroach-sensitized and -challenged mice with adoptive transfer (CRAAT+) in the L25+ group exhibited higher expression of TGF-β mRNA transcripts compared with cockroach-sensitized and -challenged mice without adoptive transfer (CRAAT−) and phosphate-buffered saline (PBS) control. The cells of CRAAT+ in the L25− group expressed substantially high levels of TGF-β mRNA transcripts compared with undetectable levels in the CRAAT− group and low levels in PBS control. The cells of CRAAT+ in the S25+ and S25− groups showed high expression of TGF-β mRNA transcripts compared with low levels in the CRAAT− group and PBS control. (C) IL-10 mRNA transcripts in post adoptive cells: Cells of the CRAAT+ in the L25+ and S25+ groups showed a significant increase in IL-10 mRNA transcripts compared with undetectable level in the CRAAT− and low levels in PBS control groups. Cells of the CRAAT+ in the L25− group exhibited considerable increase in IL-10 mRNA transcripts compared with undetectable levels in PBS control and moderate levels in CRAAT− group. Cells of the S25− group the CRAAT+ exhibited a substantially high level of IL-10 mRNA transcripts compared with low levels in PBS control and CRAAT− group. Densitometric analyses confirmed the PCR data. *P < 0.01; ** P < 0.001.


