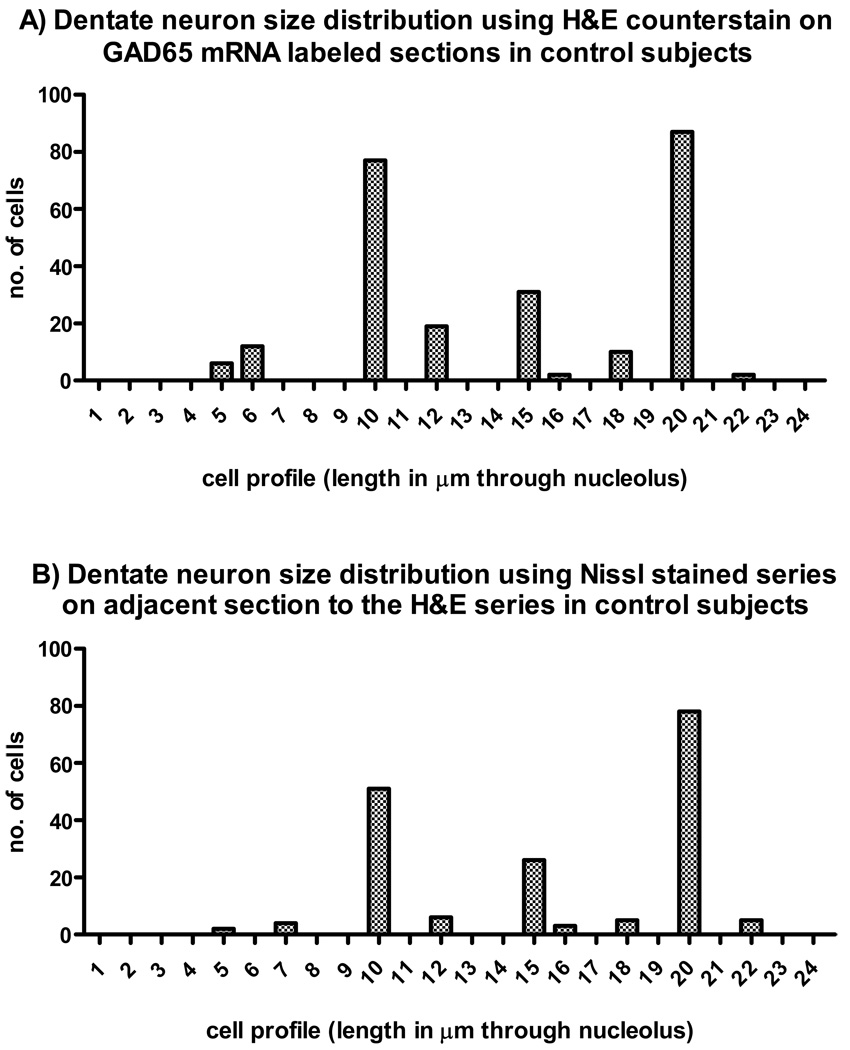
Figure 1.
Histograms showing the relative distribution of cell profiles (measured length across cell through nucleolus in mm) sampled from dentate neurons from control subjects (60 neurons from each of five cases for the H&E stain and 40 neurons for the Nissl stain). The neurons were estimated from photomicrographs captured from a light microscope (Zeiss axioskop 40) precalibrated for length measurements. A) H&E stained sections processed for in situ hybridization demonstrate two large peaks at 10 µm and 20 µm and a few lower peaks including one at 15 µm. B) Nissl-stained adjacent sections. Note that the distribution, based on neuronal profiles, are very similar in the two methods.

