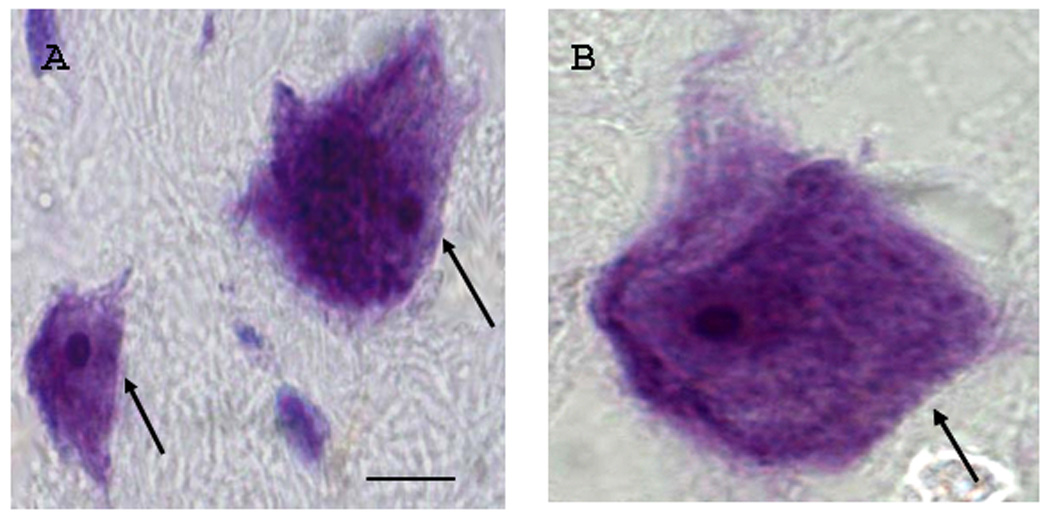
Figure 2.

Examples of Nissl-stained sections that were taken from an adjacent series to the in situ hybridization series from a control case illustrating dentate neurons of varying sizes. The photomicrographs show cell profiles (length across nucleolus in µm) in A) approximately 10 µm and 20 µm (arrows) respectively. In this study, these small and larger- sized cells were most abundant in both controls and autistic cases. The largest identified cell is shown in B (approximately 30 µm; arrow) and depicts the ranges of dentate neuronal sizes. Note that measurements were rounded such that a 10 µm cell profile represents measurements ranging from 9.50 to 10.49. Scale bar = 10 µm refers to both panels A and B.
