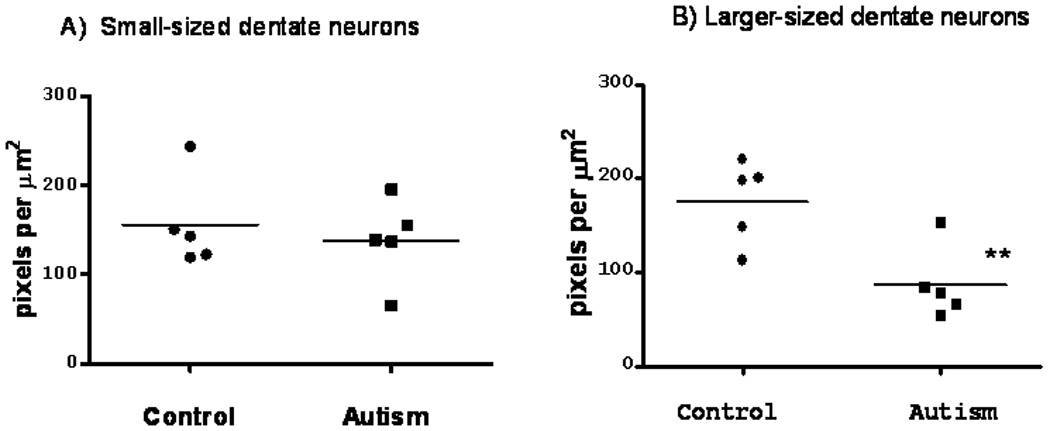
Figure 5.

Scatter plot showing the mean levels of GAD65 in the dentate nuclei in five autistic and five control subjects for small 10 µm cells (A) and larger-sized 20 µm cells. Statistical analysis of the larger cell subpopulation showed a significant reduction in GAD65 mRNA levels in the dentate nuclei in the autistic group compared to age-, PMI and pH-matched controls (P** 0.03, independent t-test).
