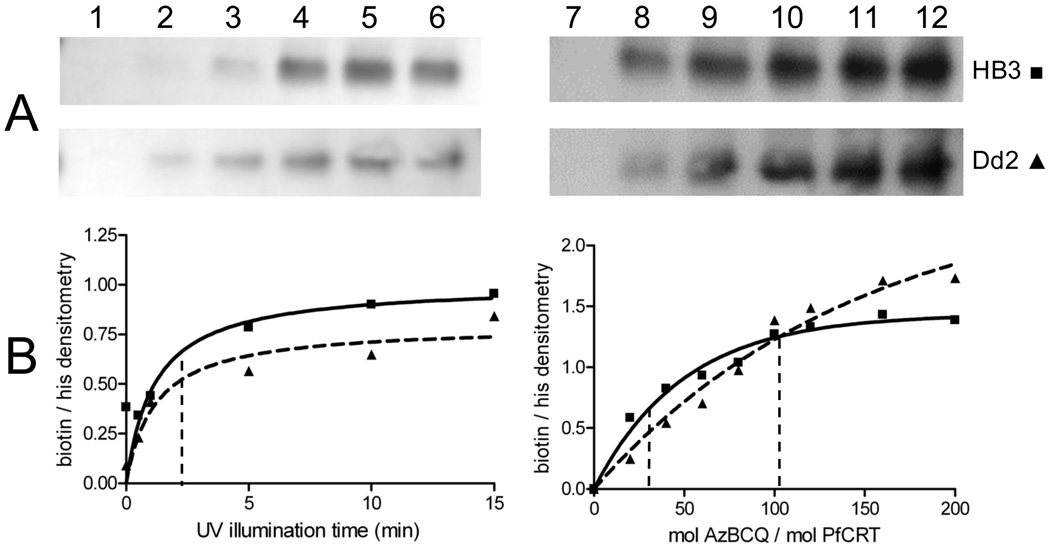
FIGURE 5.
AzBCQ labeling of HB3 and Dd2 PfCRT as a function of UV illumination time and probe concentration. Representative avidin blot strips (A) and normalized densitometry (B) of AzBCQ photolabeling of HB3 (■) and Dd2 (▲) at varying UV illumination times (left-hand side) and mole ratios of AzBCQ to PfCRT (right-hand side). When the time was varied, measurements were taken at a 50-fold molar excess of AzBCQ relative to PfCRT. For panel A (left-hand side): lane 1, 0 min; lane 2, 30 s; lane 3, 1 min; lane 4, 5 min; lane 5, 10 min; lane 6, 15 min. Each data point in panel B is the average of at least two independent experiments, and two densitometry quantifications were conducted for each gel. Half-maximal labeling vs time is denoted with the vertical dashed line (B, left-hand side). Representative avidin–HRP conjugate blot (A, right-hand side) and normalized densitometry (B, right-hand side) of HB3 and Dd2 PfCRT photolabeled with increasing amounts of AzBCQ and a 10 min UV illumination. In panel A (right-hand side), lane 7 contained no AzBCQ and lanes 8–12 contained 20-, 40-, 60-, 80-, and 100-fold molar excesses of AzBCQ, respectively. In panel B (right-hand side), we show saturation of AzBCQ photolabeling at a fixed illumination time. Each point is the average of at least two independent determinations. Half-maximal photolabeling occurs at 34- and 102-fold molar excesses of AzBCQ for the HB3 and Dd2 isoforms, respectively (first and second vertical dashed lines), as determined using the equation Y = Ymax(1 − e−Kx) (solid and dashed lines, respectively).

