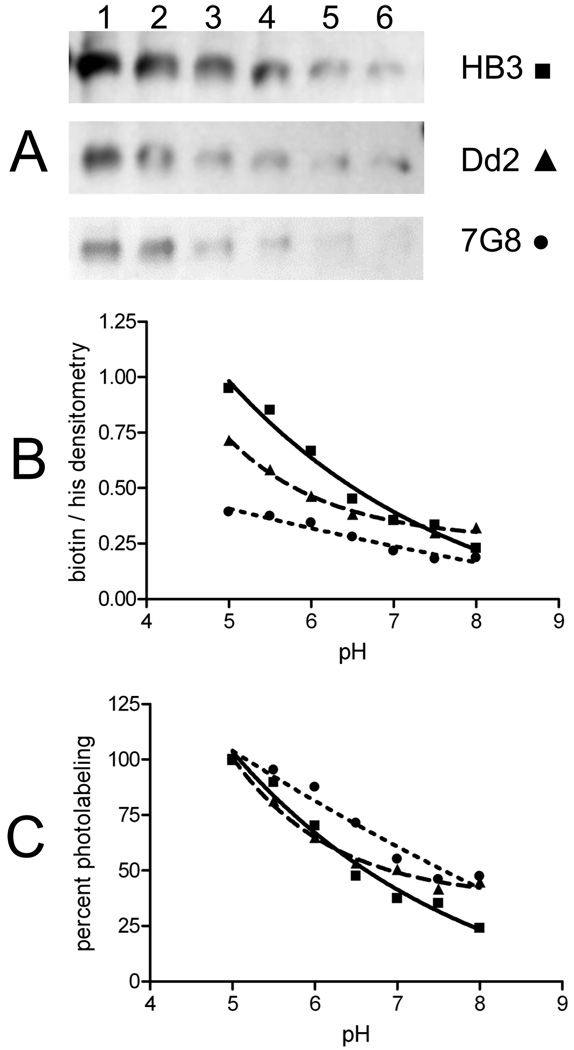
FIGURE 6.
Quantitation of labeling vs pH for multiple PfCRT isoforms. Representative avidin blot (A) and normalized densitometry of absolute (B) and percent (C) AzBCQ labeling of HB3 (■), Dd2 (▲), and 7G8 (●) at various pH values. AzBCQ was present in a 50-fold molar excess relative to protein, and the UV illumination time was 10 min. Each data point is the average of at least two independent experiments, and two densitometry quantifications were conducted for each set of gels (four in total, standard error of <3% in each case). For panel A: lane 1, pH 5.5; lane 2, pH 6.0; lane 3, pH 6.5; lane 4, pH 7.0; lane 5, pH 7.5; lane 6, pH 8.0.

