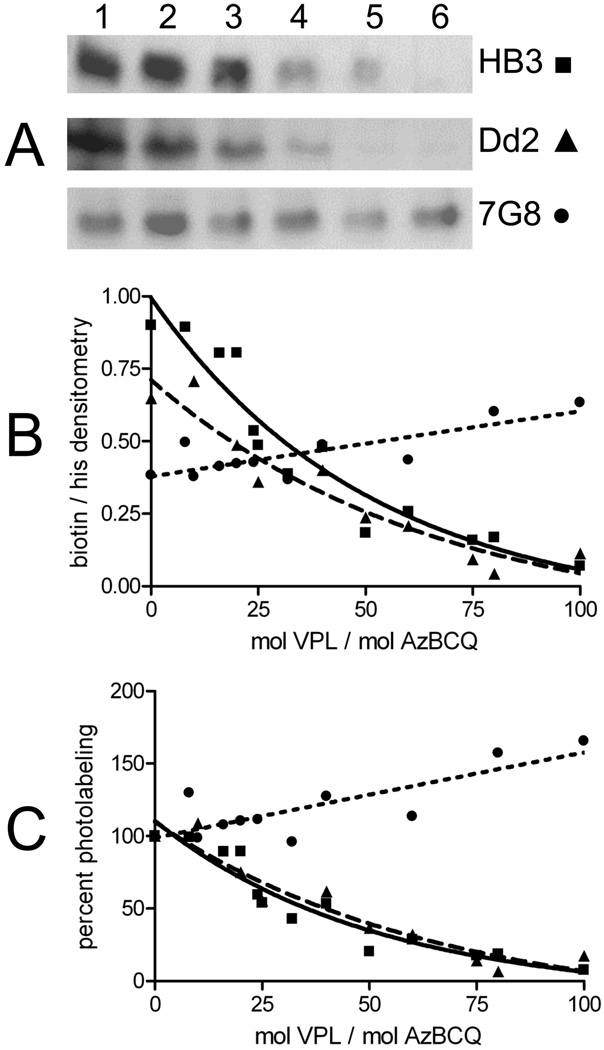
FIGURE 8.
Competition of AzBCQ labeling of HB3 and Dd2 PfCRT with VPL. AzBCQ labeling of HB3 (■), Dd2 (▲), and 7G8 (●) at varying VPL:AzBCQ molar ratios. AzBCQ was present in a 50-fold molar excess relative to protein, and the UV illumination time was 10 min. Each data point in panels B and C is the average of at least two independent experiments, and two densitometry quantifications were conducted for each set of gels (four in total, standard error of <3% in each case). For avidin blots in panel A: lane 1, no VPL competitor; lanes 2–6, 8-, 16-, 24-, 32-, and 40- fold excess of VPL relative to AzBCQ, respectively.

