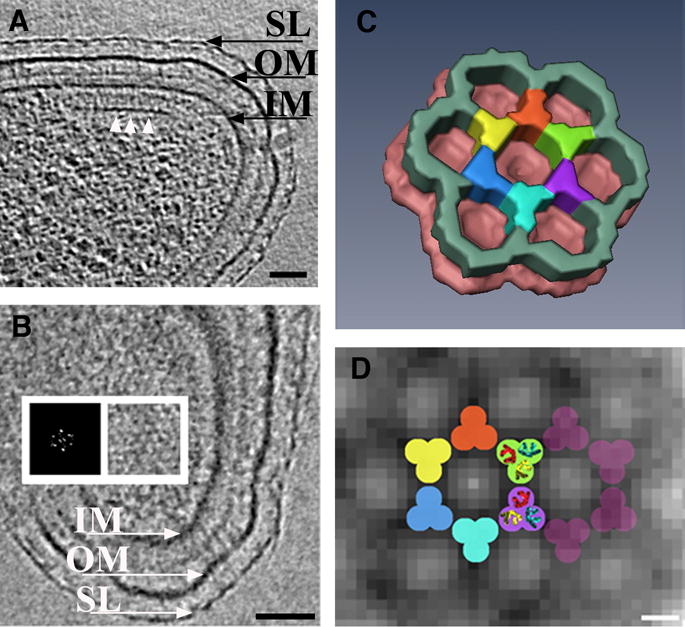
Figure 2.

Wild-type chemoreceptor array architecture in Caulobacter crescentus (A) tomographic slice perpendicular to the chemoreceptor array. The base plate composed of CheA-CheW (white arrows) is visible running parallel to the inner membrane, at a distance of 31nm. Thin pillar-like densities connecting the base plate with the inner membrane are evident. (B) Slice through the tomogram parallel to the membranes directly above the base plate. The hexagonal lattice of the chemoreceptor array is visible. A power spectrum confirms this and demonstrates a center-to-center spacing of 12nm (inset). (C) Manually segmented three-dimensional surface representation of a unit cell of the region where the base plate and the chemoreceptor tips connect. Averaging and six-fold symmetry were applied. (D) Model for the arrangement of the receptors superimposed upon tomographic data. The dimensions and symmetry of the bottom half of the trimers-of-dimers from the crystal structure (PDB ID 1QU7) fit well in each intersection of the observed hexagonal lattice. SL: S-Layer, OM: outer membrane, IM: inner membrane. Scale bars: A and B: 50 nm, D: 5nm. Courtesy of Ariane Briegel and Grant Jensen.
