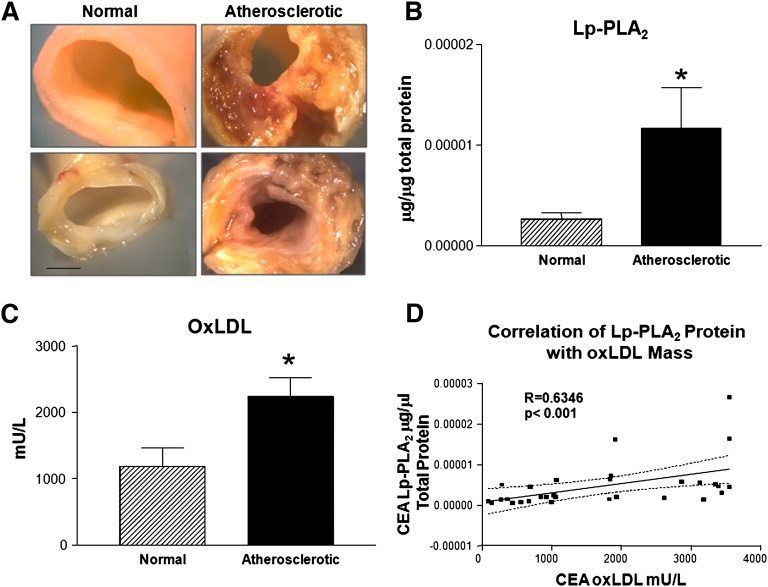
Fig. 2.
Abundance of Lp-PLA2 and oxLDL in normal and atherosclerotic CEA tissue. A: Digital images of normal and atherosclerotic CEA tissues. B: Lp-PLA2 protein abundance in normal (n = 16) and atherosclerotic CEA tissues (n = 15). C: oxLDL abundance in normal (n = 16) and atherosclerotic CEA tissues (n = 15). *P < 0.05. D: Correlation of Lp-PLA2 and oxLDL in CEA atheroma, Spearman. n = 30, bar = 2.5 mm.

